History is a unique Expert Lotto feature which provides 100% guarantee of finding the Jackpot winning ticket if several History parameters are correctly estimates.
History is based on the latest occurrences of each winning number. Most of conventional lottery strategies analyze a fixed interval of past draws. However Expert Lotto History tracks fixed count of occurrences of each number no matter how long ago the number was drawn. By default History checks 11 latest occurrences of each number in the pool, however this count is adjustable in application preferences.
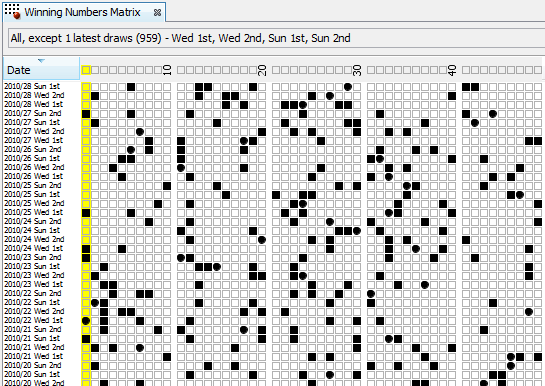
The picture below shows the matrix of winning numbers database
in
Expert Lotto 6/49 Demo Lottery without the very latest draw:
From the picture you can see that the latest occurrence of number 1 (highlighted with yellow color) happened 4 draws ago in the selected section of winning numbers database. Number 2 hit 2 draws ago, 21 draws elapsed since the latest occurrence of number 3, 10 draws elapsed since the last hit of number 4 etc. Arranged to a table the latest occurrences look like this:
| Number of draws elapsed since the latest hit of each number | |||||||||||||||||||||||||||||||||||||||||||||||||
| Number | 1 | 2 | 3 | 4 | 5 | 6 | 7 | 8 | 9 | 10 | 11 | 12 | 13 | 14 | 15 | 16 | 17 | 18 | 19 | 20 | 21 | 22 | 23 | 24 | 25 | 26 | 27 | 28 | 29 | 30 | 31 | 32 | 33 | 34 | 35 | 36 | 37 | 38 | 39 | 40 | 41 | 42 | 43 | 44 | 45 | 46 | 47 | 48 | 49 |
| Draws count | 4 | 2 | 21 | 10 | 9 | 1 | 24 | 7 | 14 | 12 | 7 | 4 | 1 | 1 | 5 | 2 | 2 | 3 | 1 | 6 | 13 | 3 | 3 | 4 | 2 | 7 | 18 | 3 | 3 | 5 | 9 | 4 | 6 | 14 | 6 | 8 | 5 | 8 | 14 | 2 | 1 | 1 | 9 | 11 | 33 | 11 | 10 | 7 | 7 |
The values in the second table row are called Level 0 in History terms.
When searching for previous hits of drawn numbers you can see from the picture above that the previous hit of number 1 happened 15 draws ago - in draw 2010/25 Wed 1st. Previous hit of number 2 can be found 5 draws ago, number 3 hit 24 draws ago etc. The table of previous hits looks like this:
| Number of draws elapsed since the second latest hit of each number | |||||||||||||||||||||||||||||||||||||||||||||||||
| Number | 1 | 2 | 3 | 4 | 5 | 6 | 7 | 8 | 9 | 10 | 11 | 12 | 13 | 14 | 15 | 16 | 17 | 18 | 19 | 20 | 21 | 22 | 23 | 24 | 25 | 26 | 27 | 28 | 29 | 30 | 31 | 32 | 33 | 34 | 35 | 36 | 37 | 38 | 39 | 40 | 41 | 42 | 43 | 44 | 45 | 46 | 47 | 48 | 49 |
| Draws count | 15 | 5 | 23 | 23 | 11 | 4 | 27 | 8 | 28 | 31 | 8 | 11 | 2 | 21 | 12 | 3 | 30 | 8 | 7 | 22 | 77 | 5 | 6 | 13 | 6 | 10 | 19 | 12 | 5 | 6 | 11 | 8 | 10 | 15 | 10 | 12 | 16 | 20 | 17 | 9 | 4 | 20 | 12 | 25 | 34 | 13 | 31 | 19 | 14 |
The values in the second table row are called Level 1 in History terms.
The same applies to other previous occurrences of each number up to Level 10 as by default the History tracks 11 latest occurrences of each number.
Now we can arrange tables for individual Levels into a grid to form a complete Number History:
| Number | Level 0 | Level 1 | Level 2 | Level 3 | Level 4 | Level 5 | Level 6 | Level 7 | Level 8 | Level 9 | Level 10 |
| 1 | 4 | 15 | 19 | 20 | 29 | 35 | 36 | 66 | 69 | 91 | 97 |
| 2 | 2 | 5 | 22 | 30 | 32 | 44 | 46 | 57 | 59 | 72 | 79 |
| 3 | 21 | 23 | 25 | 26 | 27 | 28 | 34 | 36 | 39 | 40 | 56 |
| 4 | 10 | 23 | 24 | 30 | 47 | 49 | 66 | 88 | 96 | 102 | 121 |
| 5 | 9 | 11 | 19 | 26 | 44 | 47 | 52 | 55 | 58 | 79 | 80 |
| 6 | 1 | 4 | 9 | 15 | 26 | 46 | 52 | 64 | 73 | 75 | 92 |
| 7 | 24 | 27 | 34 | 56 | 61 | 64 | 68 | 69 | 76 | 78 | 86 |
| 8 | 7 | 8 | 16 | 24 | 40 | 46 | 54 | 75 | 85 | 97 | 111 |
| 9 | 14 | 28 | 37 | 49 | 52 | 53 | 65 | 70 | 80 | 86 | 88 |
| 10 | 12 | 31 | 36 | 51 | 53 | 56 | 74 | 82 | 100 | 119 | 121 |
| 11 | 7 | 8 | 9 | 17 | 28 | 38 | 48 | 58 | 71 | 86 | 92 |
| 12 | 4 | 11 | 14 | 16 | 18 | 20 | 27 | 29 | 33 | 43 | 72 |
| 13 | 1 | 2 | 21 | 23 | 25 | 47 | 68 | 72 | 74 | 75 | 77 |
| 14 | 1 | 21 | 32 | 54 | 59 | 66 | 80 | 81 | 89 | 94 | 97 |
| 15 | 5 | 12 | 57 | 67 | 70 | 88 | 93 | 102 | 122 | 130 | 131 |
| 16 | 2 | 3 | 13 | 42 | 49 | 62 | 64 | 69 | 72 | 77 | 80 |
| 17 | 2 | 30 | 32 | 35 | 43 | 50 | 52 | 68 | 79 | 81 | 84 |
| 18 | 3 | 8 | 10 | 26 | 49 | 54 | 55 | 58 | 61 | 63 | 65 |
| 19 | 1 | 7 | 17 | 21 | 22 | 25 | 33 | 38 | 53 | 60 | 67 |
| 20 | 6 | 22 | 26 | 28 | 29 | 41 | 45 | 51 | 61 | 62 | 77 |
| 21 | 13 | 77 | 80 | 103 | 105 | 106 | 108 | 109 | 121 | 127 | 138 |
| 22 | 3 | 5 | 15 | 26 | 38 | 42 | 48 | 51 | 71 | 78 | 82 |
| 23 | 3 | 6 | 14 | 16 | 21 | 22 | 24 | 28 | 29 | 37 | 40 |
| 24 | 4 | 13 | 15 | 20 | 33 | 35 | 38 | 57 | 67 | 81 | 90 |
| 25 | 2 | 6 | 11 | 13 | 18 | 23 | 24 | 31 | 34 | 37 | 41 |
| 26 | 7 | 10 | 39 | 41 | 47 | 60 | 61 | 63 | 69 | 83 | 84 |
| 27 | 18 | 19 | 25 | 27 | 31 | 37 | 59 | 61 | 69 | 84 | 98 |
| 28 | 3 | 12 | 17 | 24 | 40 | 53 | 60 | 64 | 71 | 75 | 79 |
| 29 | 3 | 5 | 17 | 23 | 40 | 43 | 53 | 55 | 56 | 61 | 63 |
| 30 | 5 | 6 | 12 | 27 | 29 | 30 | 33 | 36 | 37 | 42 | 43 |
| 31 | 9 | 11 | 16 | 25 | 32 | 39 | 44 | 49 | 55 | 70 | 87 |
| 32 | 4 | 8 | 17 | 22 | 27 | 35 | 48 | 50 | 54 | 71 | 74 |
| 33 | 6 | 10 | 18 | 19 | 20 | 45 | 56 | 84 | 85 | 99 | 105 |
| 34 | 14 | 15 | 23 | 29 | 32 | 47 | 65 | 71 | 74 | 76 | 85 |
| 35 | 6 | 10 | 13 | 18 | 36 | 41 | 42 | 46 | 48 | 57 | 68 |
| 36 | 8 | 12 | 30 | 34 | 38 | 41 | 50 | 54 | 70 | 71 | 78 |
| 37 | 5 | 16 | 31 | 34 | 45 | 50 | 51 | 59 | 62 | 63 | 73 |
| 38 | 8 | 20 | 32 | 37 | 39 | 69 | 72 | 77 | 82 | 83 | 89 |
| 39 | 14 | 17 | 19 | 42 | 44 | 45 | 50 | 52 | 57 | 67 | 74 |
| 40 | 2 | 9 | 15 | 30 | 35 | 41 | 45 | 60 | 62 | 73 | 75 |
| 41 | 1 | 4 | 18 | 36 | 39 | 57 | 62 | 64 | 66 | 70 | 73 |
| 42 | 1 | 20 | 38 | 51 | 62 | 76 | 78 | 94 | 100 | 105 | 106 |
| 43 | 9 | 12 | 28 | 58 | 59 | 77 | 83 | 91 | 94 | 103 | 106 |
| 44 | 11 | 25 | 33 | 39 | 42 | 53 | 60 | 87 | 88 | 102 | 104 |
| 45 | 33 | 34 | 45 | 63 | 64 | 66 | 82 | 115 | 117 | 119 | 124 |
| 46 | 11 | 13 | 40 | 43 | 48 | 49 | 52 | 55 | 63 | 73 | 83 |
| 47 | 10 | 31 | 43 | 44 | 50 | 59 | 66 | 67 | 68 | 73 | 76 |
| 48 | 7 | 19 | 21 | 22 | 35 | 46 | 48 | 78 | 83 | 85 | 107 |
| 49 | 7 | 14 | 16 | 31 | 44 | 58 | 60 | 67 | 86 | 89 | 96 |
The next step is to calculate sum of all values in each Level column:
| Level 0 | Level 1 | Level 2 | Level 3 | Level 4 | Level 5 | Level 6 | Level 7 | Level 8 | Level 9 | Level 10 | |
| Sum | 363 | 758 | 1213 | 1653 | 1996 | 2404 | 2734 | 3163 | 3488 | 3864 | 4214 |
The table above shows Summary History values for the latest of the selected draws which is 2010/28 Sun 1st.
What happens after adding winning numbers from the next draw 2010/28 Sun 2nd to the Number History table above? Winning numbers for that draw are 23-29-36-42-44-47-[7].
| Number | Level 0 | Level 1 | Level 2 | Level 3 | Level 4 | Level 5 | Level 6 | Level 7 | Level 8 | Level 9 | Level 10 |
| 1 | 5 | 16 | 20 | 21 | 30 | 36 | 37 | 67 | 70 | 92 | 98 |
| 2 | 3 | 6 | 23 | 31 | 33 | 45 | 47 | 58 | 60 | 73 | 80 |
| 3 | 22 | 24 | 26 | 27 | 28 | 29 | 35 | 37 | 40 | 41 | 57 |
| 4 | 11 | 24 | 25 | 31 | 48 | 50 | 67 | 89 | 97 | 103 | 122 |
| 5 | 10 | 12 | 20 | 27 | 45 | 48 | 53 | 56 | 59 | 80 | 81 |
| 6 | 2 | 5 | 10 | 16 | 27 | 47 | 53 | 65 | 74 | 76 | 93 |
| 7 | 25 | 28 | 35 | 57 | 62 | 65 | 69 | 70 | 77 | 79 | 87 |
| 8 | 8 | 9 | 17 | 25 | 41 | 47 | 55 | 76 | 86 | 98 | 112 |
| 9 | 15 | 29 | 38 | 50 | 53 | 54 | 66 | 71 | 81 | 87 | 89 |
| 10 | 13 | 32 | 37 | 52 | 54 | 57 | 75 | 83 | 101 | 120 | 122 |
| 11 | 8 | 9 | 10 | 18 | 29 | 39 | 49 | 59 | 72 | 87 | 93 |
| 12 | 5 | 12 | 15 | 17 | 19 | 21 | 28 | 30 | 34 | 44 | 73 |
| 13 | 2 | 3 | 22 | 24 | 26 | 48 | 69 | 73 | 75 | 76 | 78 |
| 14 | 2 | 22 | 33 | 55 | 60 | 67 | 81 | 82 | 90 | 95 | 98 |
| 15 | 6 | 13 | 58 | 68 | 71 | 89 | 94 | 103 | 123 | 131 | 132 |
| 16 | 3 | 4 | 14 | 43 | 50 | 63 | 65 | 70 | 73 | 78 | 81 |
| 17 | 3 | 31 | 33 | 36 | 44 | 51 | 53 | 69 | 80 | 82 | 85 |
| 18 | 4 | 9 | 11 | 27 | 50 | 55 | 56 | 59 | 62 | 64 | 66 |
| 19 | 2 | 8 | 18 | 22 | 23 | 26 | 34 | 39 | 54 | 61 | 68 |
| 20 | 7 | 23 | 27 | 29 | 30 | 42 | 46 | 52 | 62 | 63 | 78 |
| 21 | 14 | 78 | 81 | 104 | 106 | 107 | 109 | 110 | 122 | 128 | 139 |
| 22 | 4 | 6 | 16 | 27 | 39 | 43 | 49 | 52 | 72 | 79 | 83 |
| 23 | 1 | 4 | 7 | 15 | 17 | 22 | 23 | 25 | 29 | 30 | 38 |
| 24 | 5 | 14 | 16 | 21 | 34 | 36 | 39 | 58 | 68 | 82 | 91 |
| 25 | 3 | 7 | 12 | 14 | 19 | 24 | 25 | 32 | 35 | 38 | 42 |
| 26 | 8 | 11 | 40 | 42 | 48 | 61 | 62 | 64 | 70 | 84 | 85 |
| 27 | 19 | 20 | 26 | 28 | 32 | 38 | 60 | 62 | 70 | 85 | 99 |
| 28 | 4 | 13 | 18 | 25 | 41 | 54 | 61 | 65 | 72 | 76 | 80 |
| 29 | 1 | 4 | 6 | 18 | 24 | 41 | 44 | 54 | 56 | 57 | 62 |
| 30 | 6 | 7 | 13 | 28 | 30 | 31 | 34 | 37 | 38 | 43 | 44 |
| 31 | 10 | 12 | 17 | 26 | 33 | 40 | 45 | 50 | 56 | 71 | 88 |
| 32 | 5 | 9 | 18 | 23 | 28 | 36 | 49 | 51 | 55 | 72 | 75 |
| 33 | 7 | 11 | 19 | 20 | 21 | 46 | 57 | 85 | 86 | 100 | 106 |
| 34 | 15 | 16 | 24 | 30 | 33 | 48 | 66 | 72 | 75 | 77 | 86 |
| 35 | 7 | 11 | 14 | 19 | 37 | 42 | 43 | 47 | 49 | 58 | 69 |
| 36 | 1 | 9 | 13 | 31 | 35 | 39 | 42 | 51 | 55 | 71 | 72 |
| 37 | 6 | 17 | 32 | 35 | 46 | 51 | 52 | 60 | 63 | 64 | 74 |
| 38 | 9 | 21 | 33 | 38 | 40 | 70 | 73 | 78 | 83 | 84 | 90 |
| 39 | 15 | 18 | 20 | 43 | 45 | 46 | 51 | 53 | 58 | 68 | 75 |
| 40 | 3 | 10 | 16 | 31 | 36 | 42 | 46 | 61 | 63 | 74 | 76 |
| 41 | 2 | 5 | 19 | 37 | 40 | 58 | 63 | 65 | 67 | 71 | 74 |
| 42 | 1 | 2 | 21 | 39 | 52 | 63 | 77 | 79 | 95 | 101 | 106 |
| 43 | 10 | 13 | 29 | 59 | 60 | 78 | 84 | 92 | 95 | 104 | 107 |
| 44 | 1 | 12 | 26 | 34 | 40 | 43 | 54 | 61 | 88 | 89 | 103 |
| 45 | 34 | 35 | 46 | 64 | 65 | 67 | 83 | 116 | 118 | 120 | 125 |
| 46 | 12 | 14 | 41 | 44 | 49 | 50 | 53 | 56 | 64 | 74 | 84 |
| 47 | 1 | 11 | 32 | 44 | 45 | 51 | 60 | 67 | 68 | 69 | 74 |
| 48 | 8 | 20 | 22 | 23 | 36 | 47 | 49 | 79 | 84 | 86 | 108 |
| 49 | 8 | 15 | 17 | 32 | 45 | 59 | 61 | 68 | 87 | 90 | 97 |
From the table above you can see that the value in Level 0 for all winning numbers is 1. Value in Level 1 is previous value in Level 0 + 1, value in Level 2 is previous value in Level 1 + 1, value in Level 3 is previous value from Level 2 + 1.
Number History for all other pool numbers is simply the previous value incremented by 1.
The new History Summary is then:
| Level 0 | Level 1 | Level 2 | Level 3 | Level 4 | Level 5 | Level 6 | Level 7 | Level 8 | Level 9 | Level 10 | |
| Sum | 376 | 744 | 1186 | 1670 | 1999 | 2412 | 2746 | 3158 | 3511 | 3875 | 4245 |
When compared to previous draw the Summary History values have changed this way:
| Level 0 | Level 1 | Level 2 | Level 3 | Level 4 | Level 5 | Level 6 | Level 7 | Level 8 | Level 9 | Level 10 | |
| Previous sums (2010/28 Sun 1st) | 363 | 758 | 1213 | 1653 | 1996 | 2404 | 2734 | 3163 | 3488 | 3864 | 4214 |
| Latest sums (2010/28 Sun 2nd) | 376 | 744 | 1186 | 1670 | 1999 | 2412 | 2746 | 3158 | 3511 | 3875 | 4245 |
| Difference | +13 | -14 | -27 | +17 | +3 | +8 | +12 | -5 | +23 | +11 | +31 |
Now let's pretend that we don't know the actual winning numbers from the latest draw 2010/28 Sun 2nd but that we can correctly estimate how History Summary values will change after that draw. From the table above we can see that summary value in Level 0 will increase by 13, Level 1 will decrease by -14 etc. We will use a range of +10/-10 for each estimated value to allow for errors in our estimates. So the estimate for Level 0 is that the Summary History value will increase from +3 to +23 (the actual change in Level 0 is +13 so the range is +13-10=+3 and +13+10=23). Estimated range of changes in Level 1 is -24 to -4 (the actual change in Level 1 is -14 so the range is -14-10=-24 and -14+10=-4). The same applies to other Levels. Now we can use these estimates in Expert Lotto filters to find the Jackpot winning ticket:
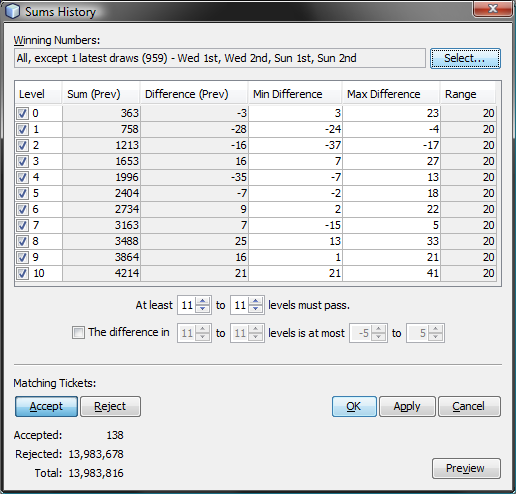
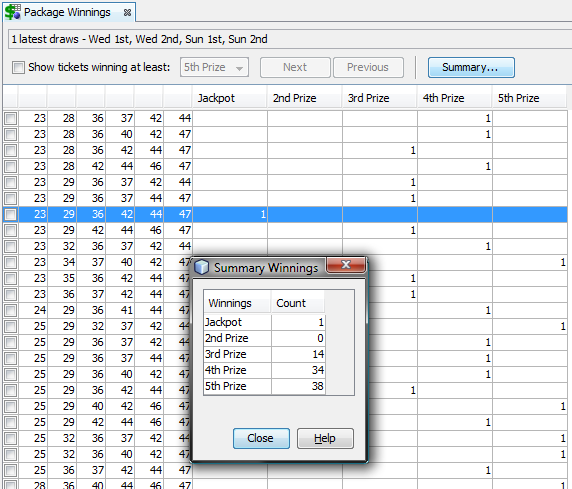
As you can see above, with History features you can reduce millions of number combinations down to a hundred or two hundred tickets while having 100% guarantee that the filtered tickets include the Jackpot winning one. However the problem is that it isn't easy to make correct estimates for all Levels. If a single Level value is out of the estimated range, the Jackpot ticket is lost. But here are various strategies to compensate for possible errors in estimated ranges.