 You can open multiple Summary History windows
- right-click
the window header and select Clone Document from its popup menu.
You can open multiple Summary History windows
- right-click
the window header and select Clone Document from its popup menu.This window opens from menu History - Summary.
The field at the top of the window shows the past draws the Summary History is calculated from. Click Select button to select a different part of winning numbers database for the Summary History window.
You can open multiple Summary History windows
- right-click
the window header and select Clone Document from its popup menu.
You can change the layout of split windows using menu View - Split orientation.
Summary History window presents its data in several forms, see below. Click buttons at the top-left corner of the window to switch its content.
Sums table shows History Sums and Differences for selected past draws. The table has the following columns:
| Date | Level 0 | Level 1 | Level 2 | Level 3 | Level 4 | Level 5 | Level 6 | Level 7 | Level 8 | Level 9 | Level 10 |
| 2010/28 Sun 1st | 363 [-3] | 758 [-28] | 1213 [-16] | 1653 [+16] | 1996 [-35] | 2404 [-7] | 2734 [+9] | 3163 [+7] | 3488 [+25] | 3864 [+16] | 4214 [+21] |
| 2010/28 Sun 2nd | 376 [+13] | 744 [-14] | 1186 [-27] | 1670 [+17] | 1999 [+3] | 2412 [+8] | 2746 [+12] | 3158 [-5] | 3511 [+23] | 3875 [+11] | 4245 [+31] |
![]() Click Date column header to change the order of draws in the
table. You can also resize column headers by dragging their borders.
Click Date column header to change the order of draws in the
table. You can also resize column headers by dragging their borders.
Button  at the top of the
window highlights Level table cells containing negative differences with red background,
positive differences are
highlighted with blue background.
at the top of the
window highlights Level table cells containing negative differences with red background,
positive differences are
highlighted with blue background.
Button Details toggles Number History and Segmentation details for selected table row. See Latest History window for detailed description. Note that winning numbers from the following draw are highlighted with black border.
Use menu History - Predictions to run automated predictions.
Segmentation table shows segment combinations for selected past draws.
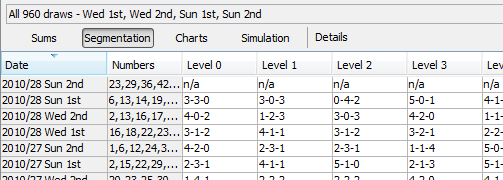
For example Level 0 for draw 2010/28 Sun 1st shows segment combination 3-3-0. That means 3 numbers from the following draw 2010/28 Sun 2nd are in Segment 1, they are numbers 23, 29 and 42. Three numbers - 36, 44 and 47 - are from Segment 2. Segment 3 for draw 2010/28 Sun 1st has none of the winning numbers of the following draw. Use button Details to see the actual number differences for given draw date.
There are no segmentation values for the latest draw as the winning numbers of the following draw are not available yet.
Button Details toggles Number History and Segmentation details for selected table row. See Latest History window for detailed description. Note that winning numbers from the following draw are highlighted with black border.
See also Segment Combinations History ticket filter.
The charts show the evolution of History values for selected draws. The charts display History Sum values, History Difference and Segmentation data for a given Level. Use Show combo box to switch the chart type. Level combo box changes the current History Level.
You can customize the charts using buttons at the top of the window.
![]() If you prefer visual perception of History data you can
estimate the future History ranges in Sum or Differences charts
conveniently:
If you prefer visual perception of History data you can
estimate the future History ranges in Sum or Differences charts
conveniently:
 to show chart range tool.
 at the top of My Estimates window to display sum values instead of differences.
 to enter the estimated range into
the fields in My Estimates window.
to enter the estimated range into
the fields in My Estimates window. at the top of My Estimates window to find which tickets in the Package
fit into your estimated ranges or drag and drop that button into a
Complex Filter window.
at the top of My Estimates window to find which tickets in the Package
fit into your estimated ranges or drag and drop that button into a
Complex Filter window.The same steps apply for range estimates in Differences chart.
![]() Click into the chart to highlight the draw nearest to mouse cursor. The selected draw will then show in Ticket Properties and Ticket Panel windows respectively.
Click into the chart to highlight the draw nearest to mouse cursor. The selected draw will then show in Ticket Properties and Ticket Panel windows respectively.
![]() See also History Level Synchronization.
See also History Level Synchronization.
Click button  to run draw simulation.