Statistics Analyzer
Analyzer window shows summary
statistics
of past winning numbers or summary statistics of tickets in the Package. Analyzer window
opens from Tickets Analyzer wizard which is available from menu File -
New - Analyzer.
Toolbar at the top of the analyzer window provides the
following
options:
 - reopens Ticket
Analyzer wizard where you can choose a different selection of tickets or draws
to be analyzed or select different statistics to be calculated.
- reopens Ticket
Analyzer wizard where you can choose a different selection of tickets or draws
to be analyzed or select different statistics to be calculated.- Analyzer list - the combo box lists statistics selected in
the
Tickets Analyzer wizard. Use the combo box to switch to a different
statistical table or chart in the analyzer window.
 - shows the
currently
selected statistics as a table, see below.
- shows the
currently
selected statistics as a table, see below.
 - shows the
currently
selected statistics as a chart, see below.
- shows the
currently
selected statistics as a chart, see below.
 Hover mouse cursor above Analyzer window title bar to
see a
tooltip showing which tickets have been analyzed, for example a
selection of past winning numbers draws or tickets in the Package.
Hover mouse cursor above Analyzer window title bar to
see a
tooltip showing which tickets have been analyzed, for example a
selection of past winning numbers draws or tickets in the Package.
Statistical
Tables
Most statistical tables in the Analyzer window have the
following
columns:
- Statistical property name - the name of the first table
column
depends on the statistics currently selected in the combo box at the
top of the Analyzer window.
- Occurrence - shows the count of tickets/draws that have the
given
statistical property.
- [%] - shows the percentage of tickets/draws that have the
given
statistical property.
Example
Odd / Even
|
Occurrence
|
[%]
|
0:6
|
134,596
|
0.96 |
1:5
|
1,062,600
|
7.60 |
2:4
|
3,187,800
|
22.80 |
3:3
|
4,655,200
|
33.29 |
4:2
|
3,491,400
|
24.97 |
5:1
|
1,275,120
|
9.12 |
6:0
|
177,100
|
1.27 |
The table above shows the ratio of odd/even ticket numbers
calculated for all possible combinations in a 6/49
lottery. From the table you can see that the most frequent combination
is 3 odd numbers and 3 even numbers. There are 4,655,200 such tickets
which makes 33.29% of all possible number combinations. The least
frequent combination is 0 : 6, there are only 134,596 such tickets,
that means 0.96% of all possible numbers combinations. So from strictly
statistical point of view number, combinations with odd/even ratio 3:3 should be preferred while number combinations with odd/even 0:6 should
be avoided when preparing your bet for the next draw.
Click any table column header to sort the table in
ascending
or descending order. Drag column header borders to resize table
columns. Drag column headers to change the order of columns in the
table.
You can change the count of decimal places used for
values in
statistical tables using menu Tools - Options - Statistics - Decimal
places.
Draw Intervals
When estimating which statistical property will hit in the
next draw
it's useful to know how many draws elapsed since the last hit of that
property in the selected section of winning numbers database.
The table below shows the odd/even ratio for the latest 30
draws in
Expert Lotto 6/49 demo lottery:
| Date |
Numbers |
Odd/Even |
| 2010/28 Sun 2nd |
23,29,36,42,44,47 [7] |
3:3 |
| 2010/28 Sun 1st |
6,13,14,19,41,42 [29] |
3:3 |
| 2010/28 Wed 2nd |
2,13,16,17,25,40 [27] |
3:3 |
| 2010/28 Wed 1st |
16,18,22,23,28,29 [24] |
2:4 |
| 2010/27 Sun 2nd |
1,6,12,24,32,41 [44] |
2:4 |
| 2010/27 Sun 1st |
2,15,22,29,30,37 [42] |
3:3 |
| 2010/27
Wed 2nd |
20,23,25,30,33,35
[7] |
4:2 |
| 2010/27 Wed 1st |
8,11,19,26,48,49 [18] |
3:3 |
| 2010/26 Sun 2nd |
8,11,18,32,36,38 [6] |
1:5 |
| 2010/26
Sun 1st |
5,6,11,31,40,43
[32] |
4:2 |
| 2010/26 Wed 2nd |
4,18,26,33,35,47 [11] |
3:3 |
| 2010/26 Wed 1st |
5,12,25,31,44,46 [33] |
3:3 |
| 2010/25 Sun 2nd |
10,15,28,30,36,43 [35] |
2:4 |
| 2010/25 Sun 1st |
16,21,24,25,35,46 [47] |
3:3 |
| 2010/25
Wed 2nd |
9,12,23,34,39,49
[24] |
4:2 |
| 2010/25 Wed 1st |
1,6,22,24,34,40 [33] |
1:5 |
| 2010/24
Sun 2nd |
8,12,23,31,37,49
[27] |
4:2 |
| 2010/24
Sun 1st |
11,19,28,29,32,39
[30] |
4:2 |
| 2010/24 Wed 2nd |
12,25,27,33,35,41 [20] |
5:1 |
| 2010/24 Wed 1st |
1,5,27,33,39,48 [36] |
5:1 |
| 2010/23 Sun 2nd |
1,12,24,33,38,42 [11] |
2:4 |
| 2010/23
Sun 1st |
3,13,14,19,23,48
[15] |
4:2 |
| 2010/23 Wed 2nd |
2,19,20,23,32,48 [24] |
2:4 |
| 2010/23
Wed 1st |
3,4,13,25,29,34
[37] |
4:2 |
| 2010/22 Sun 2nd |
4,7,8,23,25,28 [31] |
3:3 |
| 2010/22 Sun 1st |
3,13,19,27,31,44 [2] |
5:1 |
| 2010/22 Wed 2nd |
3,5,6,18,20,22 [48] |
2:4 |
| 2010/22 Wed 1st |
3,7,12,27,30,32 [1] |
3:3 |
| 2010/21 Sun 2nd |
3,9,11,20,23,43 [18] |
5:1 |
| 2010/21 Sun 1st |
1,12,20,23,30,34 [33] |
2:4 |
Blue background highlights all draws with odd/even ratio 4:2.
You
can see that this combination of odd/even numbers hasn't hit in the
last 7 draws as its latest hit is from draw 2010/27 Wed 2nd. The longest
interval between two following hits of 4:2 is 5 draws, it happened
between dates 2010/25 Wed 2nd and 2010/26 Sun 1st. The shortest draw
interval between two hits is one draw, dates 2010/24 Sun 1st and
2010/24 Sun 2nd. The average count of draws between two following hits
of odd/even combination 4:2 is 2.83.
Statistical table in Analyzer window shows the information
above in
this form:
| Odd/Even |
Occurrence |
[%] |
Latest |
AVG Interval |
Min Interval |
Max Interval |
Due |
0:6 |
134,596 |
0.96 |
n/a |
n/a |
n/a |
n/a |
n/a |
1:5 |
1,062,600 |
7.60 |
9 |
7.00 |
7 |
7 |
1.29 |
2:4 |
3,187,800 |
22.80 |
4 |
4.33 |
1 |
8 |
0.92 |
3:3 |
4,655,200 |
33.29 |
1 |
3.00 |
1 |
11 |
0.33 |
4:2 |
3,491,400 |
24.97 |
7 |
2.83 |
1 |
5 |
2.47 |
5:1 |
1,275,120 |
9.12 |
19 |
3.33 |
1 |
6 |
5.70 |
6:0 |
177,100 |
1.27 |
n/a |
n/a |
n/a |
n/a |
n/a |
- Latest - shows how many draws elapsed since the last hit of
the
given statistical property. Value 1 means that the statistical property
was found in the latest draw.
- AVG Interval - the average count of draws between two following hits
of the
given statistical property.
- Min Interval - the lowest count of draws between two hits
of the
given statistical property.
- Max Interval - the highest count of draws between two hits
of the
given statistical property.
- Due
- this columns gives a hint how likely it is - from
statistical point of view - that a given property will hit in the next
draw. Due values lower than 1 mean that the given property isn't
expected in the next draw. Due values higher than 1 mean that the given
property is long overdue and should hit in the next draw. Due values
close to 1 mean that the given property is very close to its average
hit cycle and should come up in the next draw.
For example odd/even ratio 4:2 in the example above has an average draw
interval of 2.83 draws. This combination of odd/even numbers is long
overdue because it hasn't hit for 7 draws in a row. Therefore its Due value is 7 / 2.83 = 2.47.
On the other hand, odd/even combination 3:3 has an average cycle of 3 draws and it came up in the very latest draw. Its Due value is 1 / 3 =
0.33 so it shouldn't be expected in the next draw.
Odd/even combination 2:4 hits approximately every 4 draws and it hasn't
hit for 4 draws in a row. Its Due value is 4 / 4.33 = 0.92 so it is
expected in the next draw as it is close to its average hit/skip cycle.
The draw interval data always apply to the selection of past winning
numbers made in Ticket Analyzer window under option Analyze intervals
of past winning numbers draws. The most common selection
should be either several latest draw or the whole winning numbers
database. It doesn't make much sense to analyze draw intervals of draws
that have no relation to the latest draw in your winning numbers
database. But for back-testing purposes you may want to exclude the
very latest draw to verify your lottery strategy.
Note: The number of draws elapsed since the latest hit of a
statistical property is excluded from the calculation of AVG, Min and
Max Intervals since it isn't considered as an actual hit.
Note: Value n/a in statistical tables means that are not
enough
occurrences of the given statistical property in analyzed past draws to
provide draw interval data.
Toolbar above statistical tables provides the following options:
 - hides
table rows where the Occurrence column shows value 0. It's
useful especially for tables showing many rows, for example when
analyzing triplets or quads.
- hides
table rows where the Occurrence column shows value 0. It's
useful especially for tables showing many rows, for example when
analyzing triplets or quads. - displays the
complete history of draw intervals for selected table row. See below.
- displays the
complete history of draw intervals for selected table row. See below. - exports draw intervals for all table rows into a text file or MS Excel sheet.
 - opens
Statistical Properties Filter window to accept/reject Package
tickets that have the selected statistical property or properties.
Note: This button is enabled only when the Package isn't empty.
- opens
Statistical Properties Filter window to accept/reject Package
tickets that have the selected statistical property or properties.
Note: This button is enabled only when the Package isn't empty. - copies selected table rows to system clipboard.
 - if the current analyzer view shows pool numbers then this button adds selected table rows as a new ticket to the end of the current Package contents. Note: When playing for example 6/xx lottery then this button is enabled only when exactly 6 table rows are selected.
You can select one or more table rows, click menu Edit - Copy and then switch to a complex filter window and press menu Edit - Paste to create a new Occurrences filter.
Some Analyzer tables are connected to ticket filters. For example you can selected several rows in Ticket Numbers analyzer and then open Match Numbers ticket filter. You will see that the numbers highlighted in Analyzer table are automatically pre-selected in the filter window. So you can easily build a Complex Filter that accepts/rejects number with desired statistical properties (Latest, AVG Interval, Due etc). The following ticket filters support this feature:
Interval
Details
To see the complete history of draw intervals for a selected
statistical property, click button at the top of
Analyzer window. The draw interval details tables and chart are
displayed at the bottom of Analyzer window:
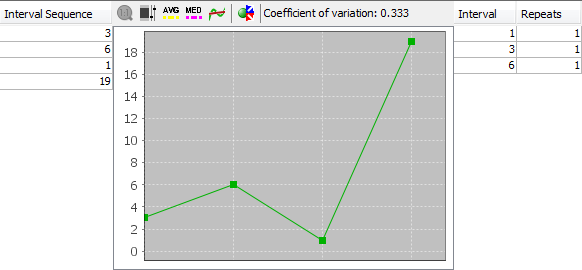
The screenshot above shows draw interval details for odd/even
ratio 4:2 for the latest 30 draws in Expert Lotto 6/49 demo lottery.
See also the tables above.
Interval Sequence table on the left-hand side shows how many
draws elapsed between each hit of 4:2 odd/even ratio. The oldest
intervals are at the top of the table, latest values are at the bottom
of the table. As you can see from the table odd/even 4:2 hasn't hit for
7 latest draws, 3 draws elapsed between the latest hit and the previous
hit of this odd/even ratio. Before that, 4:2 skipped 4 draws etc. Data
in this table correspond to statistical properties table above. Interval Sequence table also shows that the minimum interval is 1 and maximum interval is
5 (the number of draws elapsed from the latest hit is excluded from
min/max/avg interval calculation).
The same information is also available as a chart in the
middle section where you can use various chart tools to estimate the
probability that the given statistical property will hit in the next
draw.
You can toggle button  to run automated prediction of the next draw interval. The predicted value is then displayed in chart's toolbar.
You can change the layout of split windows using menu View - Split orientation.
Coefficient of variation indicator in chart's toolbar shows the measure of dispersion of data in the chart. Read more details
here.
The table on the right shows how many times each draw interval
repeats. In the example above interval of 2 draws repeats two times. It
is another hint when evaluating the statistics for the next draw: Draw
intervals with high repeat counts are likely - from
statistical point of view - to repeat again in the coming draws.
You can sort the Interval Repeats table by clicking its
column headers.
Statistical
Charts
Summary statistics are also available as bar charts where it's
easier to make a better mental picture how many
analyzed tickets have a given statistical property.
Use the toolbar at the top of Analyzer window to customize the
chart:
-
 Zoom - by default each chart shows the whole horizontal axis. You
can zoom any part of the axis by clicking into the chart and dragging
the mouse cursor to the right. To reset the zoom either click this
button or click the chart window and drag the mouse to the left.
Zoom - by default each chart shows the whole horizontal axis. You
can zoom any part of the axis by clicking into the chart and dragging
the mouse cursor to the right. To reset the zoom either click this
button or click the chart window and drag the mouse to the left. -
 Range Tool - toggles adjustable chart ranges. There are two
sliders to the right of chart window highlighting a portion of the
vertical axis when toggled on. Use your mouse to move the sliders, hold
down CTRL key to move both sliders at the same time. Alternatively you
can enter chart ranges directly from keyboard into the spinner fields
at the top and at the bottom of the sliders. The range tool
helps when evaluating how many statistical properties fall into highlighted area.
Range Tool - toggles adjustable chart ranges. There are two
sliders to the right of chart window highlighting a portion of the
vertical axis when toggled on. Use your mouse to move the sliders, hold
down CTRL key to move both sliders at the same time. Alternatively you
can enter chart ranges directly from keyboard into the spinner fields
at the top and at the bottom of the sliders. The range tool
helps when evaluating how many statistical properties fall into highlighted area. -
 Average Value - displays a horizontal line in the chart which denotes
the average occurrence of the given statistical property in analyzed
tickets.
Average Value - displays a horizontal line in the chart which denotes
the average occurrence of the given statistical property in analyzed
tickets.
-
 Additional axis - when a chart window shows more than one data set
this button can be used to toggle the display of additional vertical
axis.
Additional axis - when a chart window shows more than one data set
this button can be used to toggle the display of additional vertical
axis.
-
 - Sorts the chart in ascending order.
-
 - Sorts the chart in descending order.
- - opens Statistical Properties Filter window to accept/reject Package
tickets that have the selected statistical property or properties. Note: This button is enabled only when the Package isn't empty and chart ranges are showing.
- More - this button shows a popup menu where you can toggle additional bars
to be displayed in the chart: Latest, AVG Interval and Due. So you can
compare occurrences of each statistical property with e.g. Due values.
Hover mouse cursor above any bar in the chart window to see a
tooltip with detailed information for the corresponding statistical property.
You can export any chart as a JPG or PNG image using menu File -
Export.