Expert Lotto is a universal lottery software suitable for any numerical lottery. Expert Lotto supports:
There are many features in Expert Lotto to help you with the selection of numbers for the next draw and to improve your bet/win balance. The results of all functions are always reproducible because there is solid math behind every Expert Lotto feature. The application is not a black box providing different results each time the same function is used.
This documentation provides detailed description and explanation of all Expert Lotto features. Just press F1 key at any time while working with Expert Lotto to see how to use the current application screen or window in these help pages. It is strongly recommended to read through the Getting Started section of this manual before using Expert Lotto. Also visit our online tutorials where you can find practical, step-by-step instructions for some of the most common tasks. You can also share your experience with other Expert Lotto users in our discussion board.
When starting Expert Lotto for the very first time only Start Page window is showing and most menu and toolbar buttons are disabled. To start working with Expert Lotto you must first open a lottery. Click menu File - New - Lottery to open New Lottery wizard. Select the lottery you wish to play from the list and click Next button. Then you will be prompted to choose folder to store lottery data in. Click Finish button and select Yes button to open the new lottery. Additional application windows will open and you can start playing your lottery. If you quit Expert Lotto and then start it again the application will reopen the lottery from the folder on your disk and you can continue playing your lottery.
This way you can setup multiple lotteries, however only a single lottery can be opened in Expert Lotto at a time. To play a different lottery choose menu File - Open Lottery or pick a recent lottery using menu File - Open Recent Lottery.
Familiarize yourself with application menu and toolbars, try opening and closing various windows, customize the window layout. Don't be afraid to experiment as you can recreate the lottery setup and thus revert all changes at any time.
Expert Lotto ships with a growing list of pre-defined lotteries of all types from around the world. And if your favorite lottery isn't available you can still setup a new custom lottery. The predefined lotteries include the database of past winning numbers. However our resources are limited so we cannot track the winning numbers of all the lotteries nor can we guarantee 100% accuracy of the drawn numbers. You must contact the lottery commission or search internet to find missing draws to make your winning numbers database up-to-date. Custom-created lotteries have no winning numbers and you must import the past draws yourself.
Each lottery created with New Lottery wizard is stored in a separate folder on your disk. To open the lottery you must click menu File - Open Lottery and browse that folder. There can be only a single lottery in each folder. However you can use the New Lottery wizard to create multiple instances of the same lottery in different folders. Alternatively you can just copy the whole lottery folder to a new location. Do not create any lotteries in application's installation folder. You may loose your data when upgrading to a new application version or when uninstalling the application.
Each lottery folder contains the following files:
It is recommended to store all lottery related files - wheel files, complex filters, custom analyzers etc. - in the same lottery folder.
It is a good practise to backup your lottery folders from time to time - just use any file backup software available for your operating system.
If you no longer want to play some lottery, just make sure it isn't currently opened in Expert Lotto and simply delete its whole folder.
To find more information about the current lottery in Expert Lotto click menu Help - About and switch to Lottery tab.
![]() Click
Click ![]() button to the right of the lottery name field to create
a ZIP file with a backup copy of your lottery settings. The created ZIP
contains only the lottery settings and winning numbers database, it
does NOT include any other files from the lottery folder. This way you can share the lottery with other Expert Lotto users.
button to the right of the lottery name field to create
a ZIP file with a backup copy of your lottery settings. The created ZIP
contains only the lottery settings and winning numbers database, it
does NOT include any other files from the lottery folder. This way you can share the lottery with other Expert Lotto users.
![]() Click
Click ![]() button to the right of the lottery folder
field to open that folder in default file browser application.
button to the right of the lottery folder
field to open that folder in default file browser application.
See also lottery management tools.
Toolbars at the top of the main application window offer quick access to some of frequently used application features. All toolbars can be switched on or off using menu View - Toolbars. Alternatively you can right-click empty space in the toolbar area to invoke popup menu. You can drag and drop any toolbar to change its position in the toolbar area.
To customize to toolbars choose menu View - Toolbars - Customize or select the same action from toolbar's popup menu. This opens a new window listing all available toolbar actions which you can drag and drop to any toolbar. To remove an existing action from a toolbar drag and drop that action out of the toolbar area. Menu action View - Toolbars - Reset Toolbars restores the default toolbar set and their actions.
 - opens a new Complex Filter window.
 - opens Ticket Analyzer wizard.
 - opens a new Custom Analyzer window.
 - opens a new lottery.
 - saves changes to a complex filter or custom analyzer to disk.
 - saves all modified complex filters or custom analyzers to disk.
 - exports currently selected table.
 - prints currently selected table.
 - cuts currently selected content and puts into the system clipboard.
 - copies currently selected content and puts into the system clipboard.
 - pastes content from the system clipboard.
 - reverts the results of the last action.
 - reverts the last Undo action.
 - inserts into the Package tickets whose numbers are entered using keyboard.
 - insert tickets from selected file.
 - inserts combinations of randomly generated numbers.
 - inserts all possible combinations of selected numbers.
 - stores Package contents to a file.
 - removes some tickets from the Package using built-in filters.
 - opens Package tickets Analyzer.
 - checks winnings of Package tickets.
 - calculates the minimum win guarantee for Package tickets.
 - prints Package tickets to paper playslips.
 - ensures that each ticket is present in the Package only once.
 - sorts tickets in ascending order.
 - sorts tickets in descending order.
 - randomly changes the order of tickets in the Package.
 - replace selected ticket numbers with other numbers.
 - opens window for working with tickets with masked positions.
 - restores previous Package contents.
 - reverts the last Undo operation.
 - removes all tickets from the Package.
 - removes tagged tickets from the Package.
 - leaves in the Package only tagged tickets.
 - removes the tagging flag from all tickets in the Package.
 - tagged tickets become untagged and untagged tickets become tagged.
Show the amount of available free memory. Clicking this toolbar attempts to release obsolete internal objects to free some more memory.
Has a spinner field where you can quickly and conveniently adjust the count of History levels.
Has just a single text input field you can use for various temporary notes. It is also possible to copy/paste any ticket numbers into this field.
The whole application window is divided into several areas holding one or more internal windows. You can adjust the size of each area by dragging the border between the areas. Each internal window has its own title bar showing window name and buttons for manipulation with the window. Right-clicking window title bar brings up a popup menu offering window management functions, see below.
The central area holds the most important windows like Package Table, Winning Numbers Table, Complex Filter or Analyzer windows. Keyboard shortcut CTRL+TAB switches between these windows. You can also click drop-down button at the top right corner of this area or use menu Window - Documents.
Support windows and tools windows are arranged around the central area, for example Ticket Properties, Filters or Ticket Panel windows are positioned to the right of the central area.
You can open application windows from the main menu or by clicking main toolbar buttons or using keyboard shortcuts. Each window opens in its predefined area.
To close a window click the close button in its title bar. You can also use CTRL+W keyboard shortcut or use menu command Window - Close Window.
Each area shows just one window at a time. To show a different window simply click the title bar of the window you wish to switch to, or press the keyboard shortcut assigned to the window. The window that has input focus - reacts to keyboard commands - is the active or current window. The title bar of the active window is highlighted with a different color. Some menu and toolbar actions are related to the active window. For example Undo/Redo commands are available only when a Package window is activated. Save action is enabled only when an unsaved complex filter or custom analyzer is the active window.
All changes to the window layout are persistent over application restarts. Menu Window - Reset Windows restore the default window layout.
The window which is currently the active one - has input focus - has its title bar highlighted in a different color.
Expert Lotto is under constant development and new features are being added very frequently. Installing the updates adds new features to Expert Lotto or fixes bugs found in previous application versions or both. It is strongly recommended to install all updates when they are available.
When Expert Lotto is running and internet connection is available then the application will periodically check for new updates at Expert Lotto web server. You will see a message at the lower right corner of the main application window when new updates are available. Clicking the notification message starts update wizard which downloads and installs selected updates. In most cases the installation of updates requires application restart so make sure you have saved your work before applying the updates.
You can also check for updates manually using menu Help - Check for Updates.
Most menu and toolbar actions have a keyboard shortcut assigned - instead of clicking through the main menu you can invoke the action by pressing a combination of keys. The assigned shortcuts are visible in the main menu items and also in toolbar buttons tooltips. You can change the keyboard shortcuts and define new ones in Options window under Keymap tab. Click menu Tools - Options to open the Options window.
Keymap tab lists all available actions and their assigned shortcuts. To change a shortcut or define a new one just double-click the appropriate Shortcut column cell and press the desired combinations of keys on your keyboard.
It is recommended to spend a little time memorizing shortcuts to frequently used actions as it will greatly improve your work flow in Expert Lotto.
The whole Expert Lotto application is built as a collection of independent modules - plugins. Each module provides a different set of features.
You can see the list of plugins in the Plugins window which opens from menu Tools - Plugins. This window lists the plugins - updates - that are published on Expert Lotto server and allows the management of plugins that are already included in your Expert Lotto installation. The window consists of several tabs:
You should read through this chapter if you are upgrading from Expert Lotto version 4.x. Although you will find the Expert Lotto 5 has the same set of features (and many new ones) as version 4.x, most of the application screens were reorganized and also some common terms have been renamed to make Expert Lotto more accessible for first-time users.
| Application Page in version 4.x | Menu command in Expert Lotto 5 |
| Package | Package - Show As - Table |
| Visual Package | Package - Show As - Matrix |
| Package Winnings | Package - Show As - Winnings |
| Winning Numbers | Winning Numbers - Show As - Table |
| Visual Winning Numbers | Winning Numbers - Show As - Matrix |
| Statistics | File - New - Analyzer |
| Package Statistics | Package - Show As - Properties |
| Filter Statistics | File - New - Custom Analyzer |
| WN History | History - Latest History - Summary |
Menu command Winning Numbers - Edit opens Winning Numbers Manager window showing all past draws from your winning numbers database.
To change numbers for an existing draw - for example because
you made a
mistake when adding new draws, click the draw date you want to modify.
The fields above the table are populated with the selected draw date and winning
numbers. Enter new ticket numbers and click Replace button at the
top-right corner of the window.
Option Jackpot allows marking the selected draw date as Jackpot winning draw. That means that some lottery player got all the winning numbers right on that draw date and won the Jackpot / 1st prize.
When adding a new draw to winning numbers database first
select appropriate draw date in the fields above the table - note that
Replace button changes to Add button. Then enter the new winning
numbers and click Add button.
Button Remove deletes the selected draw(s) from the database. Regularly scheduled deleted draws automatically reappear in Add Winning Numbers window.
Tick the check box in
the last table column to hide a draw. Hidden draws remain in winning
numbers database however such draws are not included in the selection
of past draws in other application windows. You can use this feature to
temporarily remove one or more latest draws to back-test your lottery
strategies. When one or more draws are hidden then draw selection fields
start with a star sign (*) to indicate that some draws are hidden.
Note: An alternative approach for such back-testing is Cut-Off Draw Date.
Each lottery has a fixed schedule when the winning numbers are drawn. It can be for example daily or once a week on Sundays or twice a week on Wednesday and Saturday. Sometimes a draw may be postponed to other day because there's e.g. public holiday on the scheduled draw day. Draws that are out of the regular schedule are displayed using red color in winning numbers tables.
If no winning numbers were drawn on a scheduled date you can mark that draw date as void in Add Winning Numbers window. Such draw dates are displayed using strike-through font. You must tick Show all entries option to see such draws in this window.
When you are done editing your winning numbers database,
click button Save to store the changes to disk and refresh all
application windows that display winning numbers.
Button Cancel reverts all changes and keeps the winning numbers
database intact.
![]() Click Date column to sort the table in ascending or descending order.
Click Hidden column to show all hidden draws together at the top or at
the bottom of the table.
Click Date column to sort the table in ascending or descending order.
Click Hidden column to show all hidden draws together at the top or at
the bottom of the table.
Menu Winning Numbers - Analyze starts Tickets Analyzer wizard to calculate summary statistics for past winning numbers. In wizard's first step you can choose the range of past draws to be analyzed. In the next wizard step then select which statistics should be calculated. Clicking Finish button opens Analyzer window showing tables and charts for selected statistics. You can open as many Analyzer windows as you want using this menu command.
Menu Winning Numbers - Add opens a new window listing all draws that are missing in your winning numbers database up to the current calendar date. Use this feature regularly to keep your winning numbers up-to-date. Most lotteries publish their winning numbers in news papers and/or on internet. If there are many draws missing in your database then it is better to use Winning Numbers Import wizard or Winning Numbers Online Update (if available for your lottery).
Click any row in the table, enter winning numbers for the selected draw date into edit fields and then click button Add.
Option Jackpot winner allows marking the selected draw date as Jackpot winning draw. That means that some lottery player got all the winning numbers right on that draw date and won the Jackpot / 1st prize.
Click button No Draw if no winning numbers were drawn on the selected date(s). This may happen when a draw was cancelled, e.g. because of public holiday.
When you are done adding new draws, click button
Save to store the changes to disk and refresh all application windows
that display winning numbers.
Button Cancel reverts all changes and keeps the winning numbers database intact.
![]() When entering ticket
numbers prepend single-digit numbers with zero to
automatically move input focus into the next number field. For example
enter "01" instead of "1".
When entering ticket
numbers prepend single-digit numbers with zero to
automatically move input focus into the next number field. For example
enter "01" instead of "1".
Note: This window list only scheduled missing draws. If you need to enter winning numbers for a draw made out of the regular schedule then you must use Winning Numbers Manager. For example a lottery draws winning numbers on Wednesdays and Saturdays and one of Saturday's draws was postponed to Sunday to avoid a public holiday on Saturday. Mark the Saturday draw date as void using No Draw button in this window and open Winning Numbers Manager to add winning numbers for Sunday draw date.
Import Winning Numbers wizard allows batch updates of winning numbers database by importing past draws from a text file or lottery web site. The import process consists of several steps.
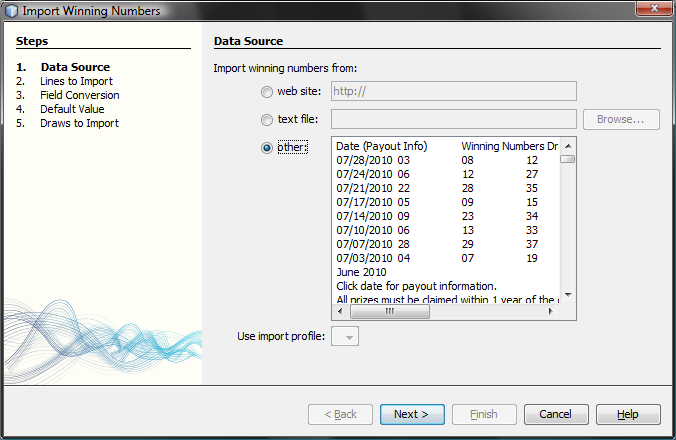
Select the source of past draws you want to import to winning numbers database. You can import either from
web site - enter the address of the web page with past winning numbers. The wizard will download that page and convert any HTML formatting and display it as plain text in the next step. Internet connection is required to use this feature.
text file - click button Browse to select a plain text or CSV file with past winning numbers. The wizard will load the file and display its contents in the next step.
other sources - copy the text with past winning numbers you wish to import and paste it into this field.
![]() You can reuse settings from previous import session
using Use import profile option. Most of the import settings will be
already pre-select in wizard's window making the import process much
smoother.
You can reuse settings from previous import session
using Use import profile option. Most of the import settings will be
already pre-select in wizard's window making the import process much
smoother.
Open https://www.nylottery.org web site, navigate to the past
results for LOTTO lottery and select the table using your mouse:
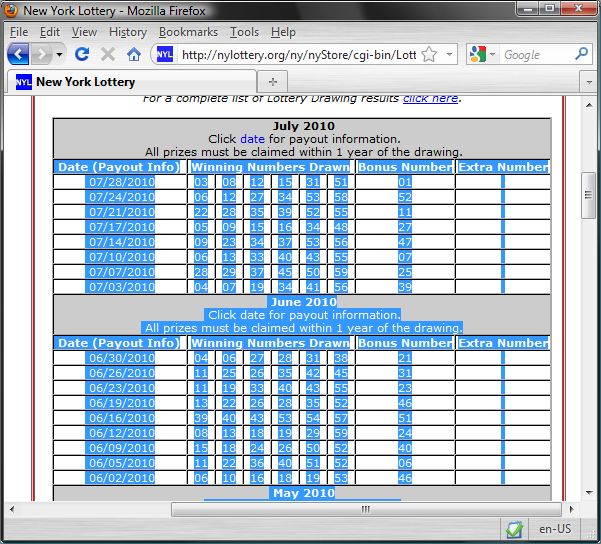
Then press CTRL+C keyboard shortcut to copy the selected text
to system clipboard. Switch back to Expert Lotto, click into the Other field and press CTRL+V keyboard shortcut to paste the text. The wizard
window will look similar to this:
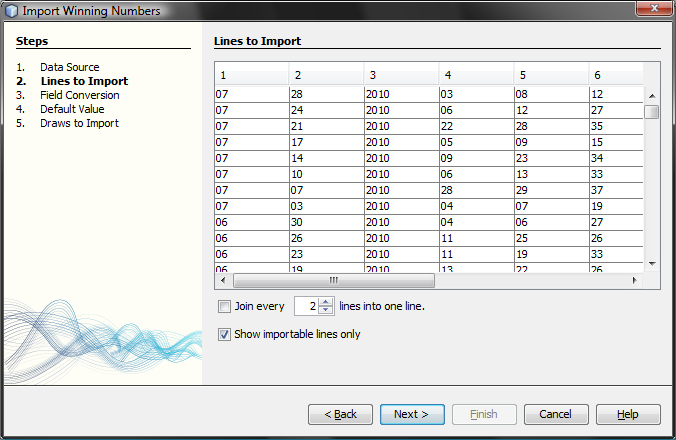
Click button Next to continue with wizard's next step.
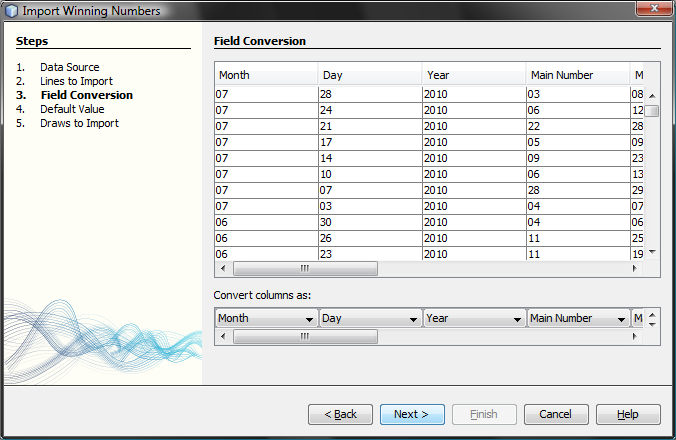
In some cases the text being imported does not have to contain enough information. For example day of week or number set name may be missing. The wizard will prompt you in this step to select default values for the missing fields.
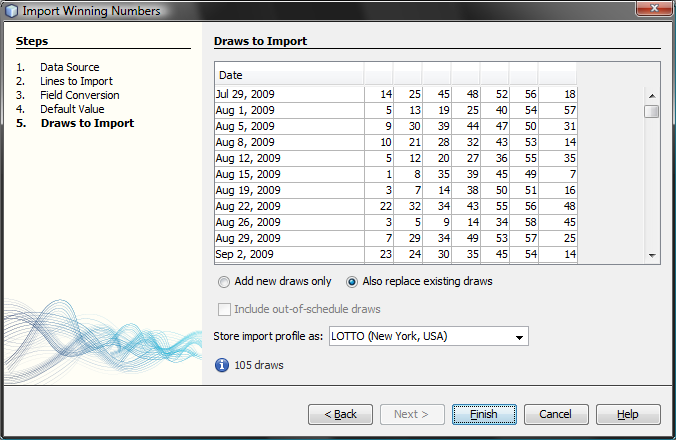
The last step shows table of draws that were successfully parsed from import data. If the table is empty you must press button Back and correct your import settings.
Use option Add new draws only to import only draws missing in your winning numbers database. Use option Also replace existing draws to add new draws and also overwrite draws which already exist in your winning numbers database. There's a message at the bottom of this window showing how many draws will be added/modified in either case.
Option Include out-of-schedule draws allows importing draws with out-of-schedule draw date. Such draws are displayed in red color in the table.
![]() Select any draws in the table and press Delete key to remove them
from the table. The removed draws will be excluded from the import.
Select any draws in the table and press Delete key to remove them
from the table. The removed draws will be excluded from the import.
Click button Finish to complete the import process and save the winning numbers database with new/modified draws to disk.
For some lotteries Expert Lotto provides built-in support for updating winning numbers online directly from lottery web site. Click menu Winning Numbers - Online Update to start Winning Numbers Online Update wizard. Internet connection is required to use this feature.
The first wizard screen lists online sources that match the settings of the current lottery - number pool size, draw schedule etc. The table shows the name of the lottery and the name of the country the lottery is being played in. If your lottery isn't listed in the table you cannot update winning numbers online and you must either add past draws manually or use Winning Numbers Import wizard.
![]() You
may email a request for
a new online source to
Expert Lotto development team by clicking button
You
may email a request for
a new online source to
Expert Lotto development team by clicking button 
Select the online source of past draws in the table and click button Next to continue. The wizard will connect to the lottery web site and download all available past draws. At the bottom of the wizard window you can see the download progress and the count of draws downloaded so far.
The next wizard window shows table of draws that were successfully downloaded. Use option Add new draws only to add only draws missing in your winning numbers database. Use option Also replace existing draws to add new draws and also overwrite draws which already exist in your winning numbers database. There's a message at the bottom of this window showing how many draws will be added/modified in either case.
Option Include out-of-schedule draws allows adding draws with out-of-schedule draw date. Such draws are displayed in red color in the table.
![]() Select any draws in the table and press Delete key to
remove them
from the table. The removed draws will not be added to winning numbers
database.
Select any draws in the table and press Delete key to
remove them
from the table. The removed draws will not be added to winning numbers
database.
Click button Finish to complete the update process and save the winning numbers database with new/modified draws to disk.
Note: The
online update may fail for various reasons - there's
no internet connection, the lottery web server doesn't respond, the web
page with past draws has moved to a different location or the format of
winning numbers archive on the lottery server has changed. You can send
an email notification to Expert Lotto development team that the
selected online source of past draws is broken. Click button  to open a
new email window and describe in details the problem you're having with
the selected online source.
to open a
new email window and describe in details the problem you're having with
the selected online source.
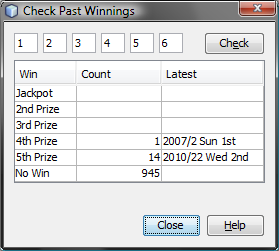
Menu command Winning Numbers - Check Winnings opens a new window where you can test any combination of numbers to see if it ever won any prize in the whole lottery history.
The
screenshot above is from Expert Lotto 6/49 demo lottery and shows that
combination of numbers 1-2-3-4-5-6 has one won one 4th prize and 14 5th
prizes. The latest win of 5th prize happened in draw 2010/22 Wednesday 2nd.
In all other 945 draws in the winning numbers database this combination
hasn't won anything.
![]() Edit field are pre-filled with current What-If numbers.
Edit field are pre-filled with current What-If numbers.
The goal of all lottery strategies is the prediction of winning numbers that will hit in the next draw. Lottery players in most cases search for the most frequent or the least frequent numbers, then examine the latest winning numbers and/or their statistical properties trying to guess what is the most likely to happen in the next draw.
Expert Lotto has built-in tool which automates the prediction process to some extent. The application will search through selected past draws and compare them with the latest winning numbers to predict the numbers and statistical properties that are expected in the coming draw. As all other Expert Lotto features, the predictions are based on solid math. With the same input data and the same settings the predictor will always provide the same, reproducible results. There is no magical black-box spitting out different numbers each time it is clicked. Expert Lotto predictor is based on pattern matching algorithm which is widely used in many other computer-assisted fields – facial recognition, statistical data analysis, signal processing etc.
The following table lists 15 latest draws in Expert Lotto 6/49 lottery in descending order:
| Date | Position 1 | Position 2 | Position 3 | Position 4 | Position 5 | Position 6 | Bonus |
| 2010/28 Sun 2nd | 23 | 29 | 36 | 42 | 44 | 47 | 7 |
| 2010/28 Sun 1st | 6 | 13 | 14 | 19 | 41 | 42 | 29 |
| 2010/28 Wed 2nd | 2 | 13 | 16 | 17 | 25 | 40 | 27 |
| 2010/28 Wed 1st | 16 | 18 | 22 | 23 | 28 | 29 | 24 |
| 2010/27 Sun 2nd | 1 | 6 | 12 | 24 | 32 | 41 | 44 |
| 2010/27 Sun 1st | 2 | 15 | 22 | 29 | 30 | 37 | 42 |
| 2010/27 Wed 2nd | 20 | 23 | 25 | 30 | 33 | 35 | 7 |
| 2010/27 Wed 1st | 8 | 11 | 19 | 26 | 48 | 49 | 18 |
| 2010/26 Sun 2nd | 8 | 11 | 18 | 32 | 36 | 38 | 6 |
| 2010/26 Sun 1st | 5 | 6 | 11 | 31 | 40 | 43 | 32 |
| 2010/26 Wed 2nd | 4 | 18 | 26 | 33 | 35 | 47 | 11 |
| 2010/26 Wed 1st | 5 | 12 | 25 | 31 | 44 | 46 | 33 |
| 2010/25 Sun 2nd | 10 | 15 | 28 | 30 | 36 | 43 | 35 |
| 2010/25 Sun 1st | 16 | 21 | 24 | 25 | 35 | 46 | 47 |
| 2010/25 Wed 2nd | 9 | 12 | 23 | 34 | 39 | 49 | 24 |
The latest three numbers at the second ticket position are: 13, 13 and 29. Those three numbers form the latest pattern. The pattern size is 3 as it consists of three numbers.
Now we will search the past winning numbers at the second ticket position and look for a similar pattern. The table above shows that the best matching past pattern can be found in draws 2010/26 Sun 2nd to 2010/27 Wed 2nd. The past winning numbers are 11, 11 and 23. The following draw is 2010/27 Sun 1st where the second winning number is 15. So the prediction for the coming draw 2010/29 Wed 1st is number 15 at the second ticket position.
Let's verify our prediction in Expert Lotto:
Winning Number Properties window opens and its table will show the following value in Position 2 column:
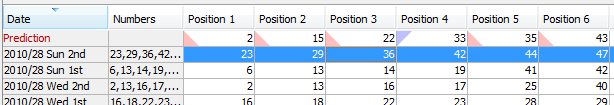
The downward red triangle indicates that the predicted trend is decrease in the next draw and the number predicted for the second ticket position is 15. See below for more instructions how to interpret the prediction results.
If we let the predictor scan the whole database of past winning numbers then it will find the best matching pattern in draws 2006/23 Sun 2nd to 2006/24 Wed 2nd. Their winning numbers are 12, 16 and 30. The following winning number at the second ticket position is 11. That means the predicted trend is again decrease and the predicted value is 11.
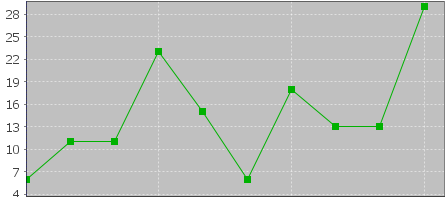
What happens if we increase the pattern size from three numbers to 10 numbers? The latest pattern is then 6,11,11,23,15,6,18,13,13,29. When displayed in a chart the numbers look like this:
The predictor will find best matching pattern in draws 2008/45 Sun 2nd to 2008/48 Wed 1st where the winning numbers are 9,20,13,21,12,8,15,15,4,27. The numbers in a chart look like this:
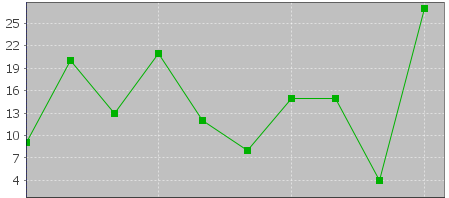
The following number at the second ticket position is again 11 (draw 2008/48 Wed 2nd). That means the predicted trend is again decrease and the predicted value is 11.
If you compare the chart of the latest pattern and the chart of the found matching pattern above, you can see that the match is actually very loose. But it is still the best match the predictor can find in the whole database of past winning numbers. We cannot realistically expect to find a sequence of past winning numbers that is exactly the same as the ten latest draws. The longer the patterns are the less similarities between the latest pattern and the best matching pattern. So how to select the optimal pattern size?
In the examples above we used pattern size 3 which gave us predicted value 11 and pattern size 10 also with predicted value 11. In this case we have the same results. But what if the predicted values or even the predicted trends were different? How to tell which prediction is more credible?
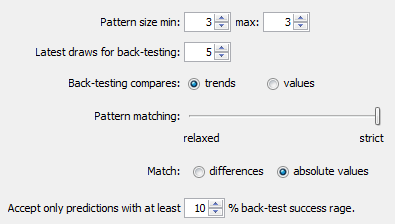
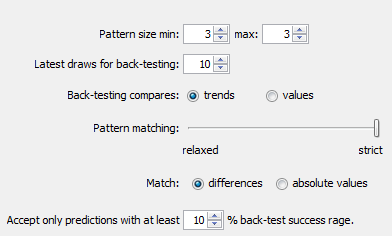
The predictor runs a series of tests and selects the best pattern size automatically. Option Latest draws for back-testing in prediction settings screen defines how deep this back-testing is. If the prediction settings are for example Pattern size min 3, max 15, Latest draws for back-testing: 10 then the predictor will make 130 predictions to pick the optimal pattern size. It will start with pattern size 3, make prediction for draw 2010/28 Sun 1st and compare the predicted trend with actual value from the following draw 2010/28 Sun 2nd. Then it will make prediction for draw 2010/28 Wed 2nd and compare the predicted trend with the value from the following draw 2010/28 Sun 1st. There will be 10 such testing predictions up to draw 2010/26 Wed 2nd. The predictor will count how many predicted trends were correct when compared with the following draws.
Then the pattern size will increase to four and the predictor will make another ten testing predictions for ten latest draws. The count of correct trend predictions is noted. The pattern size is increased to five and the testing runs are repeated. This continues up to pattern size 15 as selected in prediction settings. Then the predictor will select the pattern size that had the highest count of correct trend predictions. This optimal pattern size is then used to make the actual prediction for the latest draw 2010/28 Sun 2nd. In this case the best pattern size is 3 because seven trend predictions were correct during back-testing. When using pattern size 10, there were only 4 valid trend predictions out of the ten back-test runs.
![]() Hover mouse cursor above table cell with prediction result to see a tooltip with the best pattern size and the count of back-test predictions that were correct.
Hover mouse cursor above table cell with prediction result to see a tooltip with the best pattern size and the count of back-test predictions that were correct.
With option Back-testing compares values you can modify the prediction algorithm to select the pattern size that predicts values which are closest to the actual values when back-testing.
![]() Some lottery operators publish additional details about each draw – which set of balls has been used, which drawing machine etc. If the balls and/or machines are being changed at regular intervals it probably makes sense to use pattern sizes shorter than the interval between such changes.
Some lottery operators publish additional details about each draw – which set of balls has been used, which drawing machine etc. If the balls and/or machines are being changed at regular intervals it probably makes sense to use pattern sizes shorter than the interval between such changes.
The predictor has two modes of pattern matching. It can match either absolute values in a sequence of numbers as demonstrated above or it can match number differences instead. Let's have the following sequence of numbers:
31,35,13,20,15,5,2,10,4,25,3,10,5
Let's consider the last three numbers as the latest pattern: 3,10,5. When matching absolute values then the best matching pattern is 2,10,4 followed by number 45. However when matching number differences then the best matching pattern is 13,20,15 followed by number 5.
The same sequence of numbers expressed as value differences looks like this:
+31,+4,-22,+7,-5,-10,-3,+8,-6,+21,-22,+7,-5
So the latest pattern has changed to -22,+7,-5 and the best matching pattern is -22,+7,-5 corresponding to numbers 13,20,15 followed by number 5. So when matching differences the matching pattern must have the same shape (the order of increasing/decreasing values) as the latest pattern however all its values may be shifted up or down when compared with the latest pattern.
Now we will repeat the prediction for the second ticket number and use differences pattern matching instead of absolute values:
The best matching pattern are draws 2006/20 Wed 1st to 2006/20 Sun 1st with numbers 4,4,21, which translate to differences -3,0,+17. The following difference is -8.
The differences of the latest pattern are -5,0,+16. The predicted value is
29 – abs( -8 * (abs(-5/-3) + abs(0/0) + abs(16/17)) / 3 * ) = 29 – 9.62 = 19.
Note that the predicted value includes correction which takes into account the differences between the latest and best matching patterns.
The same prediction with pattern size 10 will find the best matching pattern at draws 2009/24 Wed 1st to 2009/26 Wed 2nd where the numbers are 5,15,15,20,13,10,14,9,6,11 and the following number is 21. The prediction is increase to 46. This prediction is conflicting with the prediction with pattern size 3. However this prediction is a bit less credible as the back-testing passed in 5 out of 10 back test runs, while pattern size 3 predictions had 6 valid trend predictions during back-testing.
![]() It is recommended to use differences pattern matching especially for predictions of derived values like History sums and differences. Absolute values pattern matching is suitable for values with a small range, for example sum root, odd/even or the actual winning numbers at individual ticket positions.
It is recommended to use differences pattern matching especially for predictions of derived values like History sums and differences. Absolute values pattern matching is suitable for values with a small range, for example sum root, odd/even or the actual winning numbers at individual ticket positions.
Pattern matching slider in Predictions Options window adjusts the weights of individual numbers when the patterns are being compared. When the slider is moved fully to the right then the pattern matching is strict and each number has the same weight.
Moving slider to the left relaxes the pattern matching as the numbers of the patterns being matched have lower weight when comparing them together. If the latest pattern is for example 6,11,11,23,15,6,18,13,13,29 then strict pattern matching may find for example pattern 9,20,13,21,12,8,15,15,4,27. With relaxed matching the best found pattern will be for example 33,16,25,14,31,11,18,12,16,30. As you can see the first few numbers of the best matching pattern match the latest pattern very loosely only. In both cases the predicted value is 10 however with relaxed pattern matching there were 9 valid back-test predictions while the strict matching produced only 7 valid predictions when back-testing on 15 latest draws. Relaxed pattern matching is recommend only when using larger pattern sizes (10 and more).
Predictions are available either from menu Winning Numbers – Predictions or from menu History – Predictions. Both menu commands start Predictions wizard.
You can track the progress of the prediction process at the lower right corner of the main window. When the process is finished the prediction results are available in Winning Numbers Properties and Winning Numbers Charts windows or in Summary History window under Sums and Charts tabs.
![]() – blue triangle indicates that the predicted trend is increase. That means the next value is expected to be greater than the latest value. The actual predicted value is also available.
– blue triangle indicates that the predicted trend is increase. That means the next value is expected to be greater than the latest value. The actual predicted value is also available.
![]() – red triangle indicates that the predicted trend is decrease. That means the next value is expected to be lower than the latest value.
– red triangle indicates that the predicted trend is decrease. That means the next value is expected to be lower than the latest value.
![]() – when both red and blue triangles are present in table cell then the predicted trend is level. That means the next value is expected to be the same as the latest value.
– when both red and blue triangles are present in table cell then the predicted trend is level. That means the next value is expected to be the same as the latest value.
Note: The predictions algorithm operates just with a sequence of numbers. In some cases the predicted value can be lower or higher than the minimum or maximum possible values. In such cases you should consider the predicted trend only.
Value n/a in prediction results means it was not possible to make valid prediction. Usually because there are not enough data to select the matching pattern.
![]() The predicted trend should be the main indicator when estimating values for the coming draw. The actual predicted value should be only a hint showing how big the predicted increase or decrease is.
The predicted trend should be the main indicator when estimating values for the coming draw. The actual predicted value should be only a hint showing how big the predicted increase or decrease is.
Hover mouse cursor over predicted cell to see a tooltip with additional information regarding the prediction. You can see how many back-test predictions were correct and the pattern size that has been used for predictions.
![]() It is recommended to ignore predictions with low percentage of successful back-test by entering required percentage of successful back-test into the last input field.
It is recommended to ignore predictions with low percentage of successful back-test by entering required percentage of successful back-test into the last input field.
Detailed information about the prediction process is available in Application Log. When the predictions are finished click menu View – Application Log. The Output window then shows the following details for each predicted value. For example:
Position 2 – name of the predicted value. In this case it is the winning number at the second ticket position.
Trend prediction: Decrease – predicted trend (increase/decrease/level)
Predicted value: 10.0 – the actual predicted value. Please note that all values are zero-based so the predicted winning number is 11.
Best pattern size: 5 – the pattern size used for the prediction.
Best weight: 1.0 – the weight used for pattern matching. The weight is always 1.0 unless relaxed pattern matching has been used.
Matching pattern: [10.0 17.0 11.0 15.0 29.0] => 10.0 – the best matching pattern found. In the case the best pattern are numbers 11,18,12,16,30. The number following this pattern is 11.
Marker: 94 – the position in the sequence of numbers where the best matching pattern has been found. Value 0 means the oldest draw.
Back-tests: 15 – the count of back tests that have been carried out to validate the pattern size.
Mean Square Error: 107.66666666666667 – shows how much the back-test prediction values differ from the actual values. The lower MSE the more accurate the back-test prediction values are.
Mean Absolute Percentage Error: 0.6399601052542229 - MAPE indicator also compares the back-test predictions with the actual values.
Valid trend predictions: 6 (40.0%) - how any back tests produced correct trend prediction.
See also Trend Predictions filter.
Winning Numbers Table window opens from menu Winning Numbers - Show As - Table and displays selected draws from winning numbers database as a plain table. Table rows are individual draws, table columns are winning numbers. The first table column shows draw date. Click the Date column header to sort the list of draws in ascending or descending order.
Click button Select at the top of the window to display a different selection of past draws in the table.
When one or more draws are selected in the table the following changes happen in application's user interface:
Click menu File - Export or menu File - Print to export the table contents to a file or to print the table respectively.
![]() Use menu Edit - Find to search for a draw with given numbers.
Use menu Edit - Delete to remove currently selected draw(s)
from the table. Note: Delete action does NOT delete draws from winning
numbers database. It only removes selected draws from the table. You
can click button Select to display removed draws in the table again.
Use menu Edit - Find to search for a draw with given numbers.
Use menu Edit - Delete to remove currently selected draw(s)
from the table. Note: Delete action does NOT delete draws from winning
numbers database. It only removes selected draws from the table. You
can click button Select to display removed draws in the table again.
Winning Numbers Matrix window opens from menu Winning Numbers
- Show As -
Matrix and displays
selected past draws as a matrix of all pool numbers. Matrix rows are
individual draws, matrix
columns are pool numbers. There are several layouts of pool numbers
available. You can switch to a different layout using Matrix Layout combo box at the bottom of Winning Numbers Matrix window.
The first matrix column shows draw date. Hover your mouse above
this column to see draw date and its winning numbers in a tooltip.
Click the Date column header to sort the draws in ascending or
descending order.
An important feature of Winning Numbers Matrix window is the
highlighting of pool numbers to improve the visual perception of past
winning
numbers.
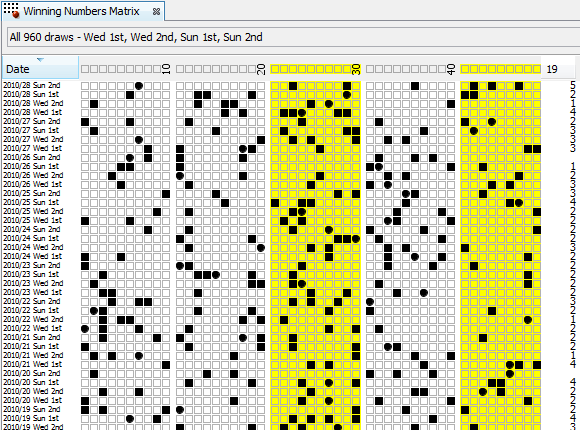
The picture above shows the latest draws from Expert Lotto 6/49 demo
lottery. Numbers 21 to 30 and numbers 41 to 49 are highlighted - their
cells
have yellow background. Note that the last column in matrix header
displays the count of highlighted numbers. Also the last column on each
matrix row shows how many highlighted numbers each ticket contains.
There are several ways to highlight numbers in the matrix:
After highlighting one or more pool numbers you can filter the
draws
in
the table by clicking Filter button at the bottom of this window.
This removes all draws from the table that contain the selected
count of highlighted numbers. The draws are NOT removed from your
winning numbers database - make a new selection of past draws by
clicking button Select at the top of the window to see the removed
draws again in this table.
Button Match Summary opens a
window
showing summary count of draws with highlighted numbers.
When one or more draws are selected in the matrix the following changes happen in application's user interface:
Click menu File - Print to print the matrix, click menu File - Export to export the table content to a file.
![]() If the matrix table is too wide for your screen or too small for your eyes you can
resize it using the slider at the bottom of the window.
If the matrix table is too wide for your screen or too small for your eyes you can
resize it using the slider at the bottom of the window.
![]() Use menu Edit - Find to search for a draw with given numbers.
Use menu Edit - Delete to remove currently selected draw(s)
from the matrix. Note: Delete action doesn't delete draws from winning
numbers database. It only removes selected draws from the matrix. You
can click button Select to display removed draws in the matrix again.
Use menu Edit - Find to search for a draw with given numbers.
Use menu Edit - Delete to remove currently selected draw(s)
from the matrix. Note: Delete action doesn't delete draws from winning
numbers database. It only removes selected draws from the matrix. You
can click button Select to display removed draws in the matrix again.
Menu command Winning Numbers - Show As - Properties opens
Winning Numbers Properties window showing a table of statistical
properties of selected past draws. Each table row represents one draw,
each table column
corresponds to a statistical property. Click Select button to choose
past draws to be displayed in this table. You can customize table
columns
using menu Tools - Options - Statistics.
The top-left corner of this window shows Columns button which opens Select Columns window where you can choose which statistical properties should show in this window. It can be useful when there are too many table columns.
![]() - toggles different background color for each table column for better visual perception. The colors are adjustable in application settings.
- toggles different background color for each table column for better visual perception. The colors are adjustable in application settings.
![]() - toggles same background color for table cells where the value matches the values in currently selected row. The colors are adjustable in application settings.
- toggles same background color for table cells where the value matches the values in currently selected row. The colors are adjustable in application settings.
![]() Click menu Winning Numbers - Predictions to run automated predictions of future values of displayed statistical properties.
Click menu Winning Numbers - Predictions to run automated predictions of future values of displayed statistical properties.
![]() You can change the order of draws in this table by
clicking Date column header. You can drag column headers to reorder table columns, drag
column header borders to resize table columns.
You can change the order of draws in this table by
clicking Date column header. You can drag column headers to reorder table columns, drag
column header borders to resize table columns.
![]() Click menu File - Export to export the table to CSV or
MS Excel file.
Click menu File - Export to export the table to CSV or
MS Excel file.
![]() Use menu Edit - Find to search for a draw with given numbers.
Use menu Edit - Delete to remove currently selected draw(s)
from the table. Note: Delete action does NOT delete draws from winning
numbers database. It only removes selected draws from the table. You
can click button Select to display removed draws in the table again.
Use menu Edit - Find to search for a draw with given numbers.
Use menu Edit - Delete to remove currently selected draw(s)
from the table. Note: Delete action does NOT delete draws from winning
numbers database. It only removes selected draws from the table. You
can click button Select to display removed draws in the table again.
See also Winning Numbers Charts.
Menu command Winning Numbers - Show As - Charts opens Winning Numbers Charts window showing statistical properties of selected past draws in a chart. Click Select button to choose past draws to be displayed in the chart. Use Show combo box to switch the chart content to a different statistical property.
You can compare the trend of currently selected statistical property with other properties. Click button Compare With at the top of this window to open a new dialog window listing all available charts. Tick the statistical properties you wish to compare the current chart with and the press OK button. This way you can display for example the chart showing Ticket Sum values and the chart showing Sum Root together.
![]() Hover mouse cursor above any chart point to see draw date and numerical value associated with that point.
Hover mouse cursor above any chart point to see draw date and numerical value associated with that point.
![]() Click any chart point to see winning numbers from the corresponding draw date in Ticket Properties and Ticket Panel windows respectively.
Click any chart point to see winning numbers from the corresponding draw date in Ticket Properties and Ticket Panel windows respectively.
![]() Click menu Winning Numbers - Predictions to run automated predictions of future values of displayed statistical properties.
Click menu Winning Numbers - Predictions to run automated predictions of future values of displayed statistical properties.
![]() You can export the chart as a JPG or PNG image using menu File -
Export.
You can export the chart as a JPG or PNG image using menu File -
Export.
See also Winning Numbers Properties.
Package is some sort of storage locker which keeps the tickets you are currently working with. It is the place where you for example load the tickets to check if you won anything in the previous draw. The Package can hold a full wheel of all possible combinations which can be filtered down to an affordable number of tickets. The Package lets you check the win guarantee of a wheel you've downloaded from internet. You can save the tickets in the Package to a file to share them with your friends. You can print Package tickets directly to paper playslips etc. There are many application features dedicated to working with Package tickets.
There are several different views available to see tickets in the Package :
You can fill the Package from different sources:
![]() When inserting tickets into the Package you can combine them with the
current Package contents in several ways - just click the little down
arrow on Insert button:
When inserting tickets into the Package you can combine them with the
current Package contents in several ways - just click the little down
arrow on Insert button:
![]()
It is possible to revert all Package operations using Undo/Redo actions. For example when you see that a filter you've just applied removed too many tickets, click menu Edit - Undo to restore tickets in the Package into the same state as before running the filter. Then you can use the filter again with different settings.
To remove all tickets from the Package click menu Package - Clear.
![]() When a Package operation is finished you can see how many tickets were
removed/added/filtered out on application's status line at the bottom
of the main application window.
When a Package operation is finished you can see how many tickets were
removed/added/filtered out on application's status line at the bottom
of the main application window.
![]() The Package content is restored after application restart and also when switching to/from a different lottery.
The Package content is restored after application restart and also when switching to/from a different lottery.
This action allows entering ticket numbers from keyboard.
![]() Click the little down arrow on Insert button to open a menu where you
can choose a different method of loading tickets into the Package:
Click the little down arrow on Insert button to open a menu where you
can choose a different method of loading tickets into the Package:
You can also press SHIFT+SPACE key when the button has input
focus to open that menu.
![]() You can select a table of numbers in e.g. MS Excel or in a plain text
CSV file and copy it to system clipboard. Then click Paste button at the lower left corner of this window to add the copied numbers to the list of tickets to be inserted into the Package.
You can select a table of numbers in e.g. MS Excel or in a plain text
CSV file and copy it to system clipboard. Then click Paste button at the lower left corner of this window to add the copied numbers to the list of tickets to be inserted into the Package.
![]() When entering ticket numbers from keyboard prepend single-digit numbers
with zero to automatically move input focus into the next number field.
For example enter "01" instead of "1".
When entering ticket numbers from keyboard prepend single-digit numbers
with zero to automatically move input focus into the next number field.
For example enter "01" instead of "1".
This action loads the Package with tickets from selected file. Clicking menu item Package - Insert - Ticket File first brings up a standard file browser window. Find the file you wish to insert into the Package and click Open button to open Insert Ticket File window with the selected file.
In this window you can choose whether you want to insert tagged tickets only or untagged tickets only or both. You can also select a different file by clicking Browse button.
Click Insert button to load the tickets from the selected file into the Package. When the loading is finished you'll see a message in main window's status bar showing how many tickets have been inserted and the name of the file the tickets come from.
![]() Click the little down arrow on Insert button to open a menu where you
can choose a different method of loading tickets into the Package:
Click the little down arrow on Insert button to open a menu where you
can choose a different method of loading tickets into the Package:
You can also press SHIFT+SPACE key when the button has input
focus to open that menu.
To insert a previously used file you can go to menu Package - Insert Recent File.
![]() You can also drag and drop a ticket file into application's main
window to open Insert Ticket File window with the dropped file already
preselected.
You can also drag and drop a ticket file into application's main
window to open Insert Ticket File window with the dropped file already
preselected.
![]() The name of the last used file shows in the status bar of Package Table, Package Properties and Package Winnings windows.
The name of the last used file shows in the status bar of Package Table, Package Properties and Package Winnings windows.
Menu command Package - Insert - Random Numbers opens the generator of random numbers to insert tickets with random numbers into the Package.
Select the count of tickets to be generated in the first field. Then choose how many random numbers each ticket will have. If you select less than the maximum count of numbers then the remaining ticket positions will be masked. The next option is the size of the pool the numbers will be randomly picked from. Use your mouse to pick pool numbers on the ticket panel.
![]() Click and drag the mouse cursor to continuously toggle the selection of
panel numbers under the cursor. Hold down SHIFT key while dragging
mouse in the panel to select numbers under the cursor, hold down CTRL key while dragging to deselect number under the cursor.
Click and drag the mouse cursor to continuously toggle the selection of
panel numbers under the cursor. Hold down SHIFT key while dragging
mouse in the panel to select numbers under the cursor, hold down CTRL key while dragging to deselect number under the cursor.
Click Insert button to generate the random combinations and load them into the Package. When the generator is finished you'll see a message in main window's status bar showing how many tickets have been inserted.
![]() Click the little down arrow on Insert button to open a menu where you
can choose a different method of loading tickets into the Package:
Click the little down arrow on Insert button to open a menu where you
can choose a different method of loading tickets into the Package:
You can also press SHIFT+SPACE key when the button has input
focus to open that menu.
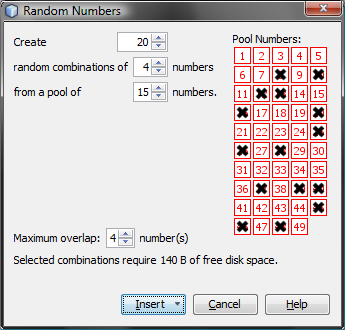
The
settings in the picture above create 20 tickets with random numbers.
Each ticket will have 4 numbers from a pool of 15 numbers. The pool
numbers are selected on the ticket panel:
8,10,12,13,16,20,25,26,28,37,39,40,45,46 and 48.
Such tickets inserted into the Package will look similar to
this:
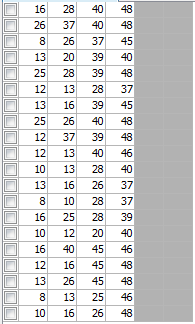
Note that the last two ticket positions are masked because only 4
ticket numbers were selected in Random Numbers window.
Option Maximum overlap defines how many numbers in each generated ticket may match numbers in other tickets. Try for example the following settings in Expert Lotto 6/49 demo lottery:
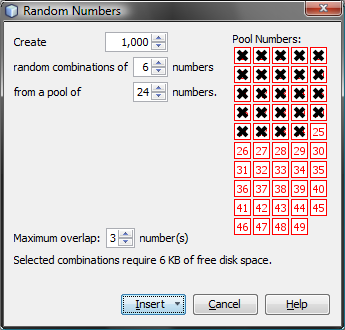
After clicking Insert button you will see a progress bar at the lower right corner of the main application window. Eventually the progress bar will get stuck at about 28%. That is because there are not that many tickets matching each other in three numbers at most. Click the progress bar to show task details and you will see that about 280 to 290 tickets were generated so far. The application is now trying to lookup the remaining random combinations it was ordered to create. However all other random tickets now match the previously generated ones in more than three numbers so the process is stalled. Click the little abort button next to the progress to cancel the ticket generator and load into the Package all tickets generated so far. Now the Package tickets may include numbers like 1-2-3-4-5-6 and 1-2-3-7-8-9 because the two tickets match each other in three numbers. But there will never be tickets like these in the Package: 1-2-3-4-5-6 and 1-2-3-4-7-8, because both tickets match each other in 4 numbers while the maximum overlap was set to 3 numbers.
![]() A message at the bottom of the window shows the disk
space required to create the selected count of random combinations.
A message at the bottom of the window shows the disk
space required to create the selected count of random combinations.
Random Numbers generator looks almost the same when playing a Powerball-like lottery. The window has just another field to adjust the size of powerball pool. Also the ticket panel has boxes for selection of numbers for the powerball pool. All other options are the same.
Note: Maximum overlap option applies to the main ticket numbers only.
When playing a Pick 3 or Pick 4 lottery the Random Numbers window differs a little. There are options to select the size of each number pool. Untick number pool check box(es) to mask appropriate ticket positions. All other options are the same.
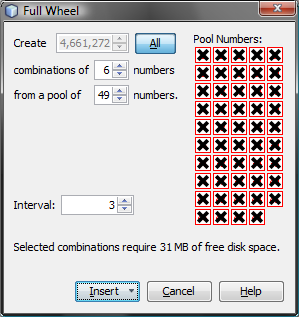
Menu command Package - Insert - Full Wheel opens a new window to insert all possible combinations of selected numbers into the Package.
Select the count of tickets
to be created in the first field or press button All to create all
possible combinations of selected numbers. For example in a 6/49
lottery there are 13,983,816 possible combinations. Entering e.g. 100
into the first field will create only the first one hundred such
combinations starting with 1-2-3-4-5-6 and ending with 1-2-3-4-7-20.
Then choose how many numbers
each ticket will have. If you select less than the maximum count of
numbers then the remaining ticket positions will be masked. The next
option is the size of the number pool. Use your mouse to pick pool
numbers on the ticket panel.
![]() Click and drag the mouse cursor to continuously toggle the selection of
panel numbers under the cursor. Hold down SHIFT key while dragging
mouse in the panel to select numbers under the cursor, hold down CTRL key while dragging to deselect numbers under the cursor.
Click and drag the mouse cursor to continuously toggle the selection of
panel numbers under the cursor. Hold down SHIFT key while dragging
mouse in the panel to select numbers under the cursor, hold down CTRL key while dragging to deselect numbers under the cursor.
Click Insert button to create the selected combinations and load them into the Package. When the generator is finished you'll see a message in main window's status bar showing how many tickets have been inserted.
![]() Click the little down arrow on Insert button to open a menu where you
can choose a different method of loading tickets into the Package:
Click the little down arrow on Insert button to open a menu where you
can choose a different method of loading tickets into the Package:
You can also press SHIFT+SPACE key when the button has input
focus to open that menu.
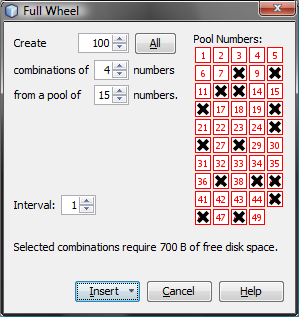
The
settings in the picture above create 100 tickets, each with four
numbers from a pool of 15 numbers.
The pool
numbers are selected on the ticket panel:
8,10,12,13,16,20,25,26,28,37,39,40,45,46 and 48.
Such tickets inserted into the Package will look exactly
like this:
Note that the last two ticket positions are masked because only 4
ticket numbers were selected in the Full Wheel window.
In some cases there are too many tickets to create a full
wheel from a selected number pool. For example in 10/80 Keno lottery
there are 1,646,492,110,120 possible combinations. Creating such a full
wheel would require about 16TB of free disk space which is way above
the limits of todays computers. That's where the Interval option comes
in. You can use it to create every N-th ticket from the full wheel to
save the required disk space. Try for example the following
settings in Expert Lotto 6/49 demo lottery:
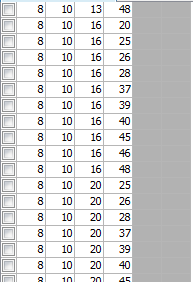
The tickets in the Package will look like this then:
The full wheel of 49 numbers starts with combinations:
1-2-3-4-5-6
1-2-3-4-5-7
1-2-3-4-5-8
1-2-3-4-5-9
1-2-3-4-5-10
... and ends with:
43-44-45-46-47-48
43-44-45-46-47-49
43-44-45-46-48-49
43-44-45-47-48-49
43-44-46-47-48-49
43-45-46-47-48-49
44-45-46-47-48-49
However
with Interval option set to 3 only every third ticket from the full
wheel will be created. Such tickets are highlighted with red color in
the list above.
This option is especially useful for Keno-like
lotteries as it provides good coverage of any full wheel while
decreasing free disk space demands.
![]() A message at the bottom of the window shows the disk
space required to create the selected full wheel.
A message at the bottom of the window shows the disk
space required to create the selected full wheel.
When playing a Pick 3 or Pick 4 lottery the Full Wheel window differs a little. There are options to select the size of each number pool. Untick number pool check box(es) to mask appropriate ticket positions.
Menu Package - Analyze starts Tickets Analyzer wizard to calculate summary statistics for the tickets in the Package. In wizard's first step you can choose past draws to be analyzed for intervals. In the next wizard step then select which statistics should be calculated. Clicking Finish button opens Analyzer window showing tables and charts for selected statistics. You can open as many Analyzer windows as you want using this menu command.
There are many types of lottery strategies. But one of the common approaches is to start with the list of all possible combinations and then remove some combinations that (don't) have required statistical properties and/or (don't) match some of the latest draws. This combination filtering is repeated until an affordable collection of combinations/tickets is achieved.
You can insert into the Package the list of all possible combination using menu Package - Insert - Full Wheel. Then use menu Package - Reduce to remove some tickets the Package:
Package filtering is also available from:
Note: You can also remove hand-picked tickets from the Package by selecting them with your mouse in any Package window and then using menu command Edit - Delete.
There is one sure way to win the lottery Jackpot - play all possible combinations. However the payouts are never so big to return the cost of such a huge bet, not to mention the time needed to fill out so many playslips. Most lottery players have limited betting budget so they play a small wheel only. Depending on your lottery strategy you can download a wheel from internet or create a new one from scratch by filtering down the whole set of all possible combinations. The filtering process excludes combinations - tickets - that are not expected to win in the next draw. It is either a manual process of going through the tickets one by one and removing those you don't like or it can be done in bulk by applying ticket filters.
Ticket filter is a simple yes/no condition. A filter accepts a ticket when the ticket numbers meet filter's condition, filter rejects a ticket if the ticket doesn't meet filter's condition. The filter condition can be either a simple check for desired ratio of odd and even numbers or the filter can compare ticket numbers with past draws or it can be a complex hierarchy of other simple filters.
To filter tickets in the Package, click menu Package - Reduce - Filter Tickets. Then select the filter you wish to apply to Package tickets and click Select button to open the selected filter. A new window opens where you can enter the settings of selected filter. At the bottom of the filter window there are buttons to run the filter:
To revert the filtering results, click menu Edit - Undo to return the Package to the same state as before filtering.
![]() When OK or Apply button is clicked in the filter window
then the current filter settings are remembered and reused as the
default settings when the filter is opened again.
When OK or Apply button is clicked in the filter window
then the current filter settings are remembered and reused as the
default settings when the filter is opened again.
![]() If you play a lottery that draws one or more bonus numbers from the same pool as the main numbers it is possible to modify the selection of past draws in filter window to merge the bonus number(s) into the main numbers. This option is available only when filtering Package tickets using a single filter. It isn't possible to merge bonus numbers with main numbers in Complex Filter window.
If you play a lottery that draws one or more bonus numbers from the same pool as the main numbers it is possible to modify the selection of past draws in filter window to merge the bonus number(s) into the main numbers. This option is available only when filtering Package tickets using a single filter. It isn't possible to merge bonus numbers with main numbers in Complex Filter window.
This filter opens from menu Package - Reduce - Mutual Match. The filter compares all tickets in the Package with each other. If there are for example 10 tickets in the Package then the first ticket will be compared with tickets 2 to 10, the second ticket will be compared with tickets 3 to 10, the third ticket will be compared with tickets 4 to 10 etc.
Let's assume the Package contains the following tickets:
01-02-03-04-05-06
01-02-03-08-09-10
01-02-03-31-32-33
01-22-23-24-25-16
01-22-23-24-25-26
This filter removes surplus tickets from the Package while maintaining the selected win guarantee. The filter opens from menu Package - Reduce - Optimize Coverage. You can use the filter either to create optimized wheels or to filter the result of your lottery strategy to reduce the cost of your bet.
Wheels with a win guarantee are usually described as "x if y (n)". Where "x" is the lowest guaranteed match when "y" winning numbers are drawn from "n" numbers the wheel is created from. For example wheel "3 if 6 (20)" guarantees at least one match 3 prize when any 6 numbers out of pool's 20 numbers hit in the next draw. The smallest possible wheel with such win guarantee contains ten tickets. It means you must bet at least 10 tickets if you want to win at least one match 3 prize. All six winning numbers must come from the twenty numbers the wheel is combined from.
Use the following steps to create an optimized wheel from 20 numbers with 3 if 6 win guarantee in Expert Lotto 6/49 Demo lottery:
Note that the resulting optimized wheel consists of 14 tickets while the smallest possible wheel for the same win guarantee needs just 10 tickets. The algorithm this filter implements will never produce wheels that match highly optimized and tightly woven wheels you can find on internet. The main purpose of this filter is the coverage optimization of tickets resulting from your lottery strategy, not creation of optimized wheels from scratch.
If you are on a tight budget, you can create even smaller optimized wheels:
In the steps above we lowered the required win guarantee from 100% to 95% and the resulting wheel consists of 8 tickets only. That is reduction by 42%. So while still having very high chance (95%) of winning at least one match 3 prize we managed to lower the wheel size significantly and thus saved a lot of money.
![]() Keep in mind that lowering the required win guarantee by a few percent or just a fraction of percent can decrease the size of optimized wheel by tens or hundreds of tickets.
Keep in mind that lowering the required win guarantee by a few percent or just a fraction of percent can decrease the size of optimized wheel by tens or hundreds of tickets.
If you have just finished applying all the filters according to your lottery strategy and the resulting set of tickets is too large for your betting budget, then there are two options. Either continue filtering with the risk of making an error in your estimates and filtering out the winning tickets. Or use Package Optimizer or Best Tickets filters to reduce the count of tickets and aim for lower tier prizes.
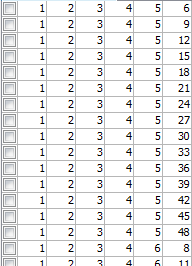
Let's use the following simple (and not very effective) lottery strategy in Expert Lotto 6/49 Demo lottery:
From statistical point of view these tickets have very high chance of winning. However so many tickets are way over any betting budget. So we will use Package Optimizer filter to go after lower tier prizes. The Package contains over half a million tickets that the filter must iterate over many times so we need to increase the filtering speed by optimizing the coverage for selected numbers only.
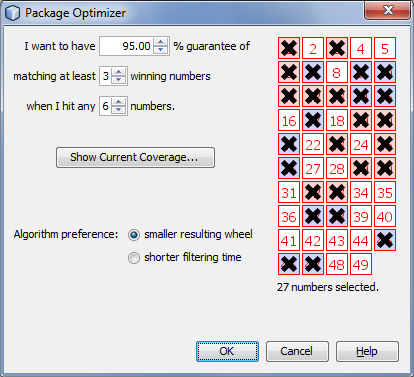
When the filtering is finished (it will take a while), there will be about 29 tickets left. Those tickets meet all the conditions of our lottery strategy above (odd/even, low/high, sum range) and have 95% chance of winning at least one Match 3 prize if the next winning numbers consist entirely from hot or cold numbers.
To verify the win guarantee, open Package Optimizer filter window again. Select the same set of numbers on the ticket panel (see the picture above) and click button Show Coverage. Then choose Show my winnings when I hit 6 numbers and click button Show.
Package Optimizer filter is capable of reducing the ticket count by several orders of magnitude while maintaining the required win guarantee.
Use the edit fields to define the required win guarantee. For example win guarantee 4 if 5 is expressed as I want to have 100% guarantee of matching at least 4 numbers when I hit any 5 numbers. It means you are guaranteed to win at least one Match 4 prize if the winning numbers include at least 5 numbers of your wheel.
It is possible to significantly reduce the count of filtered tickets (and increase filtering speed) by reducing the probability of winning the required price. For example reducing the chance from 100% to e.g. 98% or 95% still gives very high chance of winning but it will also reduce the size of resulting wheel.
Option Algorithm preference affects filter performance. When smaller resulting wheel is selected, the filter will take more time to finish however the resulting optimized wheel will be smaller and more compact. With option shorter filtering time the filter will perform faster but the resulting wheel will need more tickets to meet the required win guarantee.
The ticket panel on the right of the filter window shows all the numbers in the Package. If a number is not present than its box has gray background and cannot be ticket using mouse.
It is possible to optimize coverage for a smaller set of numbers only. Simply use your mouse to tick/untick numbers on the ticket panel. For example you can tick only numbers that the most/least frequent in several past draws, numbers that did (not) hit for a long time etc. Number coloring highlights numbers selected in statistical tables.
Show Current Coverage button calculates and shows the win coverage of tickets in the Package. Menu Package - Coverage also shows the win coverage of the tickets in the Package. However the coverage is calculated for the whole number pool, i.e. all 49 numbers in a x/49 lottery. The coverage calculator started from Package Optimizer window shows the coverage only for numbers selected on the ticket panel in the filter window. So you can see the win guarantee when you expect that the winning numbers will be drawn from a smaller set of numbers.
![]() The filtering time increases exponentially with the size of the number pool - optimizing the coverage of only 15 numbers will be fast, however optimizing the coverage of the whole 49 number pool will take hours. If possible, untick some numbers on the ticket panel in the filter window.
The filtering time increases exponentially with the size of the number pool - optimizing the coverage of only 15 numbers will be fast, however optimizing the coverage of the whole 49 number pool will take hours. If possible, untick some numbers on the ticket panel in the filter window.
![]() The filter runs much faster on modern multi-core CPUs. Check the number of execution cores your CPU has, then click menu Tools - Options - Miscellaneous - Execution and enter the number of cores into Number of threads for long running tasks field.
The filter runs much faster on modern multi-core CPUs. Check the number of execution cores your CPU has, then click menu Tools - Options - Miscellaneous - Execution and enter the number of cores into Number of threads for long running tasks field.
![]() You can watch the filter progress at the lower right corner of the main window. Click the progress bar to see additional info about the current size of the wheel and the current coverage percentage. You can stop the filter if the coverage is high enough (e.g. 90% or 95%).
You can watch the filter progress at the lower right corner of the main window. Click the progress bar to see additional info about the current size of the wheel and the current coverage percentage. You can stop the filter if the coverage is high enough (e.g. 90% or 95%).
![]() Always check the current coverage before applying this filter. If the win guarantee of the tickets in the Package is e.g. 92% before using this filter then it doesn't make sense to require 100% win guarantee.
Always check the current coverage before applying this filter. If the win guarantee of the tickets in the Package is e.g. 92% before using this filter then it doesn't make sense to require 100% win guarantee.
See also Best Tickets filter.
This filter finds the best or worst tickets in the Package. The filter opens from menu Package - Reduce - Best Tickets.
![]() Use this filter as the last step of your lottery strategy when
the amount of tickets left in the Package is still too large for your betting
budget.
Use this filter as the last step of your lottery strategy when
the amount of tickets left in the Package is still too large for your betting
budget.
See also Package Optimizer filter.
This ticket filter accepts or reject randomly selected tickets in the Package. The filter opens from menu Package - Reduce - Random Selection.
You can use this filter as the last step of your lottery strategy when the amount of tickets left in the Package is too large for your betting budget. You can consider this filter as optimized 'quick pick' as it will select a few tickets at random. But the tickets in the Package already passed all your lottery strategy filters so you should have much larger chance of winning than choosing a totally random quick pick at lottery agent's shop. An alternate filter is Systematic Selection or Best Tickets filter.
This ticket filter accepts or reject every N-th ticket in the Package. The filter opens from menu Package - Reduce - Systematic Selection.
Let's assume the Package contains the following tickets:
01-02-03-04-05-06
01-02-03-04-05-07
01-02-03-04-05-08
01-02-03-04-05-09
01-02-03-04-05-10
01-02-03-04-05-11
01-02-03-04-05-12
01-02-03-04-05-13
01-02-03-04-05-14
01-02-03-04-05-15
Then after filtering with settings Accept every 4th ticket the Package will contains only the following tickets:
01-02-03-04-05-09
01-02-03-04-05-13
Most statistical tables in Analyzer window offer a convenient
way of filtering Package tickets according to statistical
properties selected in the table. Just highlight one or more
table rows using your mouse and then click button
in Analyzer window toolbar. The same filter opens from corresponding Analyzer chart after clicking button in chart's toolbar.
Note: This button is enabled only when the Package isn't empty.
button in Analyzer window.See also Repeating Numbers ticket filter.
button in Analyzer window.See also Statistical Filter.
button in the chart window.See also Numbers at Positions ticket filter.
Most charts in Winning Numbers Charts window offer a convenient
way of filtering Package tickets according to the range of statistical
properties highlighted in the chart window. First click button ![]() in chart's toolbar to display movable chart ranges and then use sliders to the right of the chart window to highlight a vertical section of the chart where you think the value from the next draw will fall in. Then click button
in chart's toolbar to open filter window and filter ticket in the Package.
in chart's toolbar to display movable chart ranges and then use sliders to the right of the chart window to highlight a vertical section of the chart where you think the value from the next draw will fall in. Then click button
in chart's toolbar to open filter window and filter ticket in the Package.
Note: This button is enabled only when the Package isn't empty and chart's movable ranges are showing.
button in Winning Numbers Chart window.See also Numbers at Positions ticket filter.
Menu command Package - Save to File opens standard file browser window where you can choose the folder and file name the Package tickets will be saved to. You can choose the format of saved file in Files of type combo box:
Then window Save Package to File opens showing the full path to the selected file. You can pick a different file by clicking Browse button.
Button Save saves the current Package contents to the selected file. You can use options Tagged and Un-tagged to save only tagged tickets or only un-tagged tickets or both (default settings).
![]() You can also export the Package Table directly to
spreadsheet processor application with menu command File - Export.
You can also export the Package Table directly to
spreadsheet processor application with menu command File - Export.
Menu command Package - Print to Playslip opens a new Print to Playslips window where you can print the Package tickets directly to paper playslips. When printing for the very first time you might be prompted to select the default playslip layout for the current lottery in Playslips manager window. The playslip layout is a template which defines the dimensions and positions of number grids. If you want to print tickets to a different playslip type click button Customize next to the playslip layout field to open Playslips window where you can choose a different playslip layout for the current lottery and/or customize layout's settings.
When option Print page numbers is selected then each printed playslip will include the indexes of printed tickets. For example 13-18 means that the six tickets printed to this playslips are at positions 13 to 18 in the Package. If a playslip fails to print correctly, e.g. because the printer didn't load the playslip straight, you can use the ticket indexes to print them again.
Click button Print test playslip to make a test print-out which fills all number boxes.
When printing to playslips for the very first time, the printed markers probably will not align into grid boxes. It is because each printer make and type has different unprintable margins at the top and on the left of paper sheet. You must compensate these inaccuracies by adjusting print margins in Print to Playslips window:
The picture below is paper playslip for Czech lottery Sportka.

Load several playslips into your printer. Make sure the playslip orientation matches the layout of ticket panel as displayed in the application. In this case the lowest number in the first grid must be in the upper left corner.
Click Print test playslip button. The test printout will be similar to the picture below.
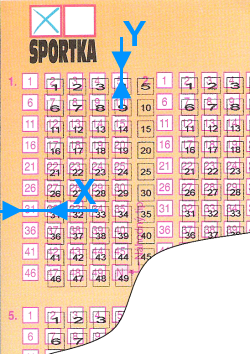
As you can see, the markers need shifting to the left and also a bit to the top. Measure distance X as indicated in the picture above and enter it as a negative number into Print margins left field. Note: To shift markers to the right, measure the distance and enter it as positive number.
Then measure distance Y as indicated in the picture above and enter it as a negative number into Print margins top field. Note: To shift the markers down, measure the distance and enter it as positive number.
Then make a new test print out and now the printed markers should align with playslip's grid boxes.
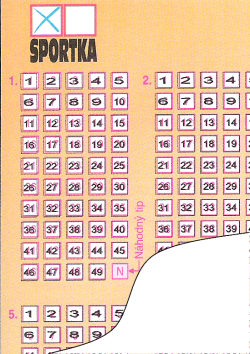
Note: The correct print margins are stored in your lottery settings and reused on next application startup.
Use menu command Package - Check Winnings to see the winnings of tickets in the Package. For example you can load into the Package the tickets you bet last week, add the latest draw to your winning numbers database and then use this window to check if you won anything.
Enter the drawn numbers into edit fields and click Check button. The count of winning prizes is shown in the table below. You can also click down-arrow button to open a popup list of all draws from your winning numbers database. Click any draw in the list to populate the edit fields with its winning numbers. The date of the selected draw is displayed below the edit fields. Click button Check to recalculate the winnings.
Note: Don't forget to bring your winning numbers database up-to-date before checking the winnings of your latest bet.
Column Payout shows the money payouts for given prize category. Double-click any field in that column to adjust the payouts. Column Total shows the break down of winnings per prize category.
Fields below the table show the total winnings, the total cost of the bet and net profit. The cost of single bet is adjustable using menu Tools - Options - Miscellaneous - Payouts.
![]() Edit fields are pre-initialized with the current What-If numbers. If this feature is turned off, the edit fields contain the winning numbers from the latest draw.
Edit fields are pre-initialized with the current What-If numbers. If this feature is turned off, the edit fields contain the winning numbers from the latest draw.
Win Coverage window opens from menu Package - Coverage and shows the minimum win guarantee for Package tickets.
First select how many numbers you expect to hit then click Show button. The coverage is calculated and the table below shows the win guarantee achieved when you hit the selected count of numbers.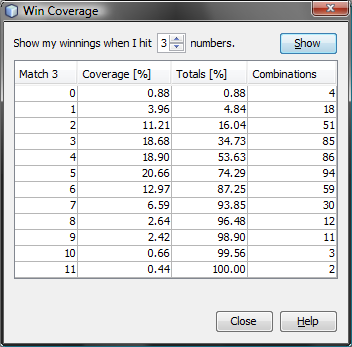
The screenshot above shows the win coverage for 100 random
combinations of 15 numbers in a 6/49 lottery. If you hit any 3 numbers
from the 15 numbers in the pool then the worst-case scenario is winning
nothing as shown on the first table row. Four triplets out of 455
possible combinations of three numbers are missing in Package tickets
so the chances of winning nothing are 0.88%.
The second table row gives 3.96% chance of winning at least one Match 3 prize.
You can win six Match 3 prizes with the probability of 12.97%. But
there's also 87.25% chance of wining six Match 3 prizes OR five Match 3 prizes OR four Match 3 prizes OR three Match 3 prizes OR two Match 3 prizes OR one Match 3 prize OR winning nothing.
The best case scenario is winning eleven Match 3 prizes with the chance
of 0.44%.
Another example shows the win coverage for the same 100 random combinations of 15 numbers when six numbers are hit:
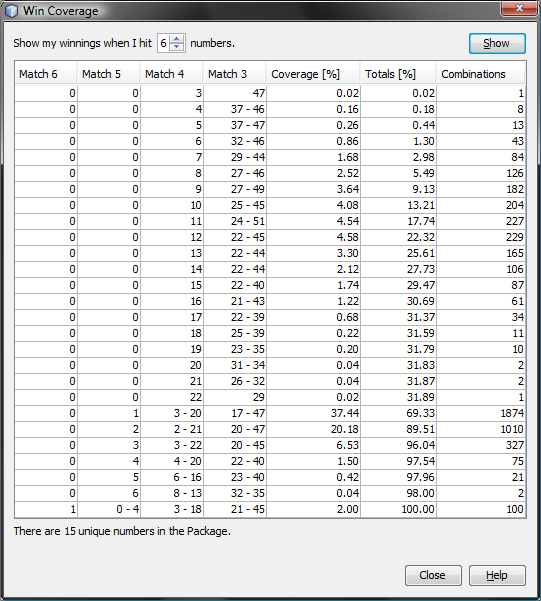
You can win at least three Match 4 prizes AND 47 Match 3 with
the chance of 0.02% when hitting any six numbers.
There's a 0.16% chance of winning four Match 4 prizes AND 37 to 46
Match 3 prizes.
The third table row shows you can win five Match 4 prizes AND 37 to 47
Match 3 prizes OR four Match 4 prizes AND 37 to 46 Match 3 prizes OR three Match 4 prizes AND 47 Match 3 prizes with the chance of 0.44%.
The best case scenario is winning one Jackpot prize AND up to 4 Match 5 prizes AND 3 to 18 Match 4 prizes AND 21 to 45 Match 3 prizes. As you
can see on the last table row the chances are 2%.
![]() Right-click the results table to open popup menu to export or print the
table.
Right-click the results table to open popup menu to export or print the
table.
See also Package Optimizer filter.
Some lotteries allow to play more than the regular count of numbers in a single bet. For example some lottery operators allow to play 9 or 10 numbers in a 6/xx lottery. It is usually called system bet.
There are 210 possible ways to pick six numbers from a pool of ten numbers. So if you play a single ten number line in a system bet you are actually 210 combinations of six numbers in a regular 6/xx lottery. Playing five such system bet lines covers 1050 combinations of six numbers - althoug some numbers will overlap so the actual coverage will be slightly lower.
You can use menu Package - System Bet to create such a system bet from tickets in the Package. First you must choose how many numbers are to be added to each ticket in the Package. The more numbers you choose the smaller the resulting system bet. Naturally system bets are more expensive when adding more numbers.
Next you must choose how many tickets you want to cover in your system bet. Selecting 100% ensures that the resulting system bet wheel includes all tickets in the Package. Lowering the percentage to e.g. 95% means that about 5% of Package tickets will be missing in the system bet. However such option may greatly reduce the system bet size thus lowering the cost of the bet.
Option Algorithm preference allows to get smaller (and cheaper) system bet when set to smaller resulting wheel or you can create the system bet faster by selecting shorter processing time. However in this case the resulting wheel will be slightly larger.
After pressing OK button the application will open a new window where you can track the progress of system bet creation. Current coverage shows how many Package tickets are covered in the system bet so far. Combinations count shows how many lines the system bet has. You can abort the process any time when you see the coverage is high enough.
Note: This feature is available for Jackpot-like lotteries only. It does not work for Pick-N and Powerball lotteries.
Menu command Package - Swap Numbers opens a new window you can use to replace selected numbers with other numbers in all Package tickets.
The window lists all numbers found in Package tickets in a table. The first column shows the original number, the second column is the number to be replaced with. To change the replacement number click into the appropriate cell in the second column and pick a new number from the popup list. You can also choose to mask ticket position containing the original number by choosing the last item from the popup list labeled <mask>.
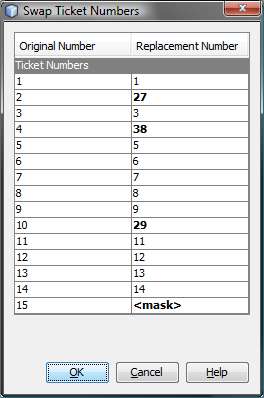
The settings above replace number 2 with number 27, number 4 with
number 38 and number 10 with number 29. Tickets positions with number
15 will be masked.
When such number swap is applied to e.g. full wheel of 15
numbers ranging 1 to 15 then the Package tickets will change from this:
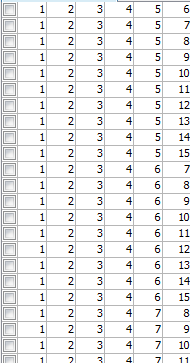
to this:
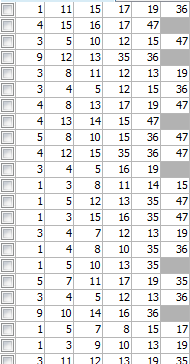
Note that after the swap the numbers within each ticket are resorted.
This feature is useful when using optimized wheels with predefined win guarantee. Such wheels are usually built using numbers ranging 1 to N. So with Swap Numbers function you can replace the wheel numbers with the numbers you think have the best chance of hitting in the next draw.
This window opens from menu Package - Mask Numbers. You can use it to replace selected pool numbers with masked numbers in all tickets in the Package.
First on the ticket panel tick the numbers you want to mask then press Ok button. Each ticket in the Package will have the selected numbers masked. Masked positions are displayed as grey rectangles in ticket tables.
See also Masked Positions.
Masked positions allow hiding one or more ticket positions so
in e.g. 6/49 lottery you can work with tickets with five or less numbers
instead of 6 numbers. Masked positions are displayed as grey rectangles
in ticket tables:
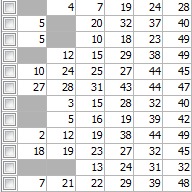
To manage tickets with masked positions in the Package click menu Package - Masked Positions. This opens a new window where you can select the desired ticket positions and then click buttons to:
You can mask ticket positions in several ways:
Replace Ticket window opens from menu Edit - Replace. You can use it to change the numbers of a selected ticket in the Package. The numbers being replaces are shown in read-only boxes at the top of this window. Enter new ticket numbers into edit fields or click appropriate boxes in the Ticket Panel to select new ticket numbers.
Button Replace changes the ticket numbers in currently selected ticket only. Button Replace All scans the whole Package and replaces the numbers of all tickets with the same numbers as the selected ticket. When finished the status bar at the bottom of the main application window shows the count of replaced tickets.
Note: The menu command is enabled only when a Package window is activated (Table, Matrix, Winnings, Properties) and just one ticket is selected in Package table.
Package Table window opens from menu Package - Show As - Table and displays Package content as a plain table. Table rows are Package tickets, table columns are ticket numbers. The first table column serves for ticket tagging. To tag a ticket click its first column. Click the first column again to untag it.
When one or more tickets are selected in the table the following changes happen in application's user interface:
Click menu File - Export or menu File - Print to export the Package table contents to a file or to print the Package table respectively.
Status bar at the bottom of this window shows the count of tickets in the Package and the index of currently selected ticket.
![]() Use menu Edit - Find to search for a ticket with given numbers.
Use menu Edit - Replace to change ticket numbers in currently selected
ticket. Use menu Edit - Delete to remove currently selected ticket(s)
from the Package. Menu commands Edit - Undo and Edit - Redo revert the results of the last Package
operation.
Use menu Edit - Find to search for a ticket with given numbers.
Use menu Edit - Replace to change ticket numbers in currently selected
ticket. Use menu Edit - Delete to remove currently selected ticket(s)
from the Package. Menu commands Edit - Undo and Edit - Redo revert the results of the last Package
operation.
![]() The Package content is restored after application restart and also when switching to/from a different lottery.
The Package content is restored after application restart and also when switching to/from a different lottery.
Package Matrix window opens from menu Package - Show As -
Matrix and displays
Package content as a matrix of all pool numbers. Matrix rows are
Package tickets, matrix
columns are pool numbers. There are several layouts of pool numbers
available. You can switch to a different layout using Matrix Layout combo box at the bottom of Package Matrix window.
The first matrix column serves for ticket
tagging. To tag a ticket click its first column. Click the first column
again to untag it.
An important feature of Package Matrix window is the
highlighting of pool numbers to improve visual perception of ticket
numbers.
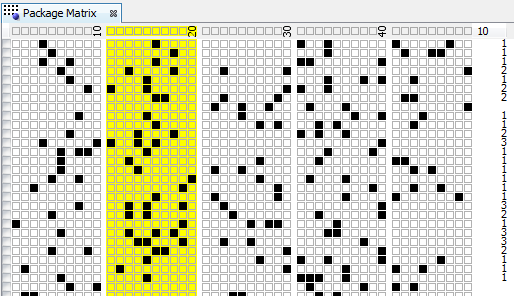
The picture above shows the highlight of numbers 11 to 20 - their matrix cells
have yellow background. Note that the last column in matrix header
displays the count of highlighted numbers. Also the last column on each
matrix row shows how many highlighted numbers each ticket contains.
There are several ways to highlight numbers in the matrix:
After highlighting one or more pool numbers you can filter tickets in the Package by clicking Filter button at the bottom of this window. This removes all tickets from the Package that contain the selected count of highlighted numbers. Button Match Summary opens a window showing summary count of tickets with highlighted numbers.
When one or more tickets are selected in the matrix the following changes happen in application's user interface:
Status bar at the bottom of this window shows the count of tickets in the Package and the index of currently selected ticket.
![]() If the matrix table is too wide for your screen or too small for your eyes you can
resize it using the slider at the bottom of the window.
If the matrix table is too wide for your screen or too small for your eyes you can
resize it using the slider at the bottom of the window.
![]() Use menu Edit - Find to search for a ticket with given numbers.
Use menu Edit - Replace to change ticket numbers in currently selected
ticket. Use menu Edit - Delete to remove currently selected ticket(s)
from the Package. Menu commands
Edit - Undo and Edit - Redo revert the results of the last Package
operation.
Use menu Edit - Find to search for a ticket with given numbers.
Use menu Edit - Replace to change ticket numbers in currently selected
ticket. Use menu Edit - Delete to remove currently selected ticket(s)
from the Package. Menu commands
Edit - Undo and Edit - Redo revert the results of the last Package
operation.
Menu command Package - Show As - Properties opens Package
Properties window showing a table of statistical properties of tickets
in the Package. Each table row represents one ticket in the Package,
each table column corresponds to a statistical property. You can
customize the columns using menu Tools - Options - Statistics.
The top-left corner of this window shows Columns button which opens Select Columns window where you can choose which statistical properties should show in this window. It can be useful when there are too many table columns.
![]() Drag column headers to reorder table columns, drag
column header borders to resize table columns.
Drag column headers to reorder table columns, drag
column header borders to resize table columns.
![]() Click menu File - Export to export the table to CSV or
MS Excel file.
Click menu File - Export to export the table to CSV or
MS Excel file.
Status bar at the bottom of this window shows the index of currently selected ticket and the total count of tickets in the Package.
![]() Use menu Edit - Find to search for a ticket with given numbers. Use
menu Edit - Replace to change ticket numbers in currently selected
ticket. Use menu Edit - Delete to remove currently selected ticket(s)
from the Package.
Use menu Edit - Find to search for a ticket with given numbers. Use
menu Edit - Replace to change ticket numbers in currently selected
ticket. Use menu Edit - Delete to remove currently selected ticket(s)
from the Package.
Package Winnings window opens from menu Package - Show As - Winnings and displays Package tickets and the prizes they might have won in the lottery history. The first table column serves for ticket tagging. To tag a ticket click its first column. Click the first column again to untag it. The next columns contain ticket numbers and the last set of columns shows the count prizes each ticket would have won when compared with the selected range of past winning numbers draws.
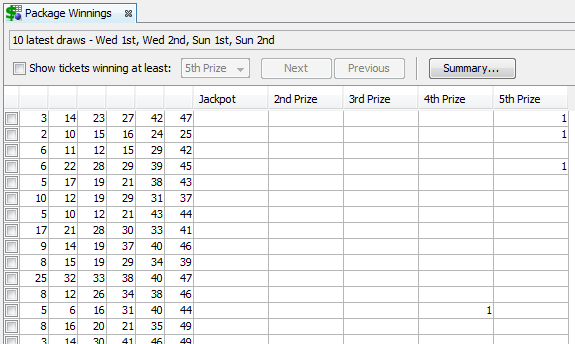
The image above shows Package Winnings of several random
combinations in Expert Lotto 6/49 demo lottery. You can see that for
example ticket 3-14-23-27-42-47 would have won one 5th prize during the
latest 10 draws. Ticket 5-6-16-31-40-44 would have won one 4th prize.
![]() Hover mouse cursor above any table cell to see the latest matching draw.
Hover mouse cursor above any table cell to see the latest matching draw.
Click Select button at the top of this window to choose which past winning numbers draws should be compared with Package tickets to calculate the winnings.
Option Show tickets winning at least hides tickets that haven't won anything or won only lower prizes than the one selected in the combo box next to this option. If there are more than 100 tickets winning at least the selected prize, button Next becomes enabled and you can click it to display next 100 such Package tickets. Click button Previous to display previous batch of tickets winning the desired prize. To see the winnings for all Package tickets untick option Show tickets winning at least.
Button Summary displays a new window showing the summary count of winning tickets for each prize.
When one or more tickets are selected in the table the following changes happen in application's user interface:
Click menu File - Export or menu File - Print to export the table contents to a file or to print the table respectively.
Status bar at the bottom of this window shows the count of tickets in the Package and the index of currently selected ticket.
![]() You can resize prize columns by dragging column edge with your mouse.
You can resize prize columns by dragging column edge with your mouse.
![]() Use menu Edit - Find to search for a ticket with given numbers.
Use menu Edit - Replace to change ticket numbers in currently selected
ticket. Use menu Edit - Delete to remove currently selected ticket(s)
from the Package. Menu commands Edit - Undo and Edit - Redo revert the results of the last Package
operation.
Use menu Edit - Find to search for a ticket with given numbers.
Use menu Edit - Replace to change ticket numbers in currently selected
ticket. Use menu Edit - Delete to remove currently selected ticket(s)
from the Package. Menu commands Edit - Undo and Edit - Redo revert the results of the last Package
operation.
There is one sure way to win the lottery Jackpot - play all possible combinations. However the payouts are never so big to return the cost of such a huge bet, not to mention the time needed to fill out so many playslips. Most lottery players have limited betting budget so they play a small wheel only. Depending on your lottery strategy you can download a wheel from internet or create a new one from scratch by filtering down the whole set of all possible combinations. The filtering process excludes combinations - tickets - that are not expected to win in the next draw. It is either a manual process of going through the tickets one by one and removing those you don't like or it can be done in bulk by applying ticket filters.
Ticket filter is a simple yes/no condition. A filter accepts a ticket when the ticket numbers meet filter's condition, filter rejects a ticket if the ticket doesn't meet filter's condition. The filter condition can be either a simple check for desired ratio of odd and even numbers or the filter can compare ticket numbers with past draws or it can be a complex hierarchy of other simple filters.
To filter tickets in the Package, click menu Package - Reduce - Filter Tickets. Then select the filter you wish to apply to Package tickets and click Select button to open the selected filter. A new window opens where you can enter the settings of selected filter. At the bottom of the filter window there are buttons to run the filter:
To revert the filtering results, click menu Edit - Undo to return the Package to the same state as before filtering.
![]() When OK or Apply button is clicked in the filter window
then the current filter settings are remembered and reused as the
default settings when the filter is opened again.
When OK or Apply button is clicked in the filter window
then the current filter settings are remembered and reused as the
default settings when the filter is opened again.
![]() If you play a lottery that draws one or more bonus numbers from the same pool as the main numbers it is possible to modify the selection of past draws in filter window to merge the bonus number(s) into the main numbers. This option is available only when filtering Package tickets using a single filter. It isn't possible to merge bonus numbers with main numbers in Complex Filter window.
If you play a lottery that draws one or more bonus numbers from the same pool as the main numbers it is possible to modify the selection of past draws in filter window to merge the bonus number(s) into the main numbers. This option is available only when filtering Package tickets using a single filter. It isn't possible to merge bonus numbers with main numbers in Complex Filter window.
This filter accepts only tickets that have the selected ratio of odd and even main numbers.
When filter settings are 3 odd numbers and 3 even numbers then:
Note: Number zero is considered to be an even number.
This filter accepts only tickets that have the selected ratio of low and high main numbers. Number is low when it is in the lower half of number pool, number is high when it is in the upper half of number pool.
For example in a x/40 lottery, numbers 1 to 20 are low, numbers 21 to 40 are high numbers. In a x/49 lottery, numbers 1 to 24 are low, numbers 25 to 49 are high.
When filter settings are 3 low numbers and 3 high numbers then:
This filter accepts tickets that have the sum of their main numbers within specified range.
Note: When playing powerball-like lotteries, which draw one or more numbers from a separate pool, then the powerball number(s) is not included in ticket's sum value.
When filtering with settings Min Sum: 180, Max Sum: 200 then:
See also Ticket Sum statistics.
This filter is similar to Sum Range filter. The filter accepts tickets that have the sum of their main numbers within specified range and the sum value is either odd or even.
Note: When playing powerball-like lotteries, which draw one or more numbers from a separate pool, then the powerball number(s) is not included in ticket's sum value.
When filtering with settings Even sums, Min sum: 180, Max sum: 200 then:
When filtering with settings Even sums, Min sum: 181, Max sum: 181 then the filter rejects all tickets. Sum of even numbers can never be odd number.
See also Ticket Sum statistics and Sum Range filter.
This filter accepts tickets with selected sum root values. Sum root is a single digit number ranging from 1 to 9. It is calculated from arithmetic sum of ticket's main numbers by repeatedly summing the digits of the sum value until only a single digit number is left.
Ticket sum value for number combination 1-2-3-4-5-6 is 1+2+3+4+5+6=21 so ticket's sum root is 2+1=3.
Ticket sum of ticket 6-20-23-29-38-42 is 158. Its sum root is then 1+5+8=14 -> 1+4=5.
See also Sum Root statistics.
This filter is similar to Sum Range filter. It accepts tickets that have the sum of their odd or even numbers within specified range.
Note: When playing powerball-like lotteries which draw one or more numbers from a separate pool then the powerball number(s) is not included in ticket's sum value.
When filtering with settings Sum of odd numbers is 180 to 200 then:
When filtering with settings Sum of even numbers is 181 to 181 then the filter rejects all tickets. Sum of even numbers can never be odd number.
See also Odd/Even Numbers Sum statistics and Sum Range filter.
This filter is similar to Sum Range filter. It accepts tickets that have the sum of their low or high numbers within specified range.
Note: When playing powerball-like lotteries which draw one or more numbers from a separate pool then the powerball number(s) is not included in ticket's sum value.
When filtering with settings Sum of high numbers is 180 to 200 then:
See also Low/High Numbers Sum statistics and Sum Range filter.
This filter is similar to Sum Range filter. The filter accepts tickets that have the selected least significant digit in the sum of their main numbers.
Note: When playing powerball-like lotteries which draw one or more numbers from a separate pool then the powerball number(s) is not included in ticket's sum value.
When filtering with settings Sum's Last Digit: 0, 1 then:
See also Sum's Last Digit statistics and Sum Range filter.
The filter accepts tickets that have the sum of their first and/or last digits in the selected range. Each pool number breaks down into two digits. The first digit is the leading digit of the number, the last digit is the second digit of the number. For example the first digit of number 23 is 2, the last digit of that number is 3. The first digit of number 9 is 0, the last digit of that number is 9.
When filter settings are Sum of first and last digits is min: 25 max: 25 then
When filter settings are Sum of first digits is min: 0 max: 0 then
See also First/Last Digits Sum statistics.
This filter is similar to Sum Root filter - it accepts tickets with selected sum root values calculated from first and/or last digits. Sum root is a single digit number ranging from 1 to 9. It is calculated from arithmetic sum of ticket's first or last digits of main numbers by repeatedly summing the digits of the sum value until only a single digit number is left.
Note: When playing powerball-like lotteries which draw one or more numbers from a separate pool then the powerball number(s) is not included in ticket's sum value.
When filtering with settings Sum root of last digit is: 3, 5 then:
Note: When filter with settings Sum root of first and last digits is... then the filter behaves the same way as Sum Root filter.
See also Digits Sum Root statistics.
The filter is the same as Sum Root filter except that it is applied either to ticket's odd number or to ticket's even numbers only.
See also Odd/Even Numbers Sum Root statistics.
See also Low/High Numbers Sum Root statistics.
Filter accepts tickets that have the desired count of selected main numbers.
Use your mouse to select the numbers you're looking on ticket panel in filter window. Then choose Match Count table how many of the selected numbers each accepted ticket must have.
When filter settings are Match Count: 2,3,4, Numbers: 10,15,16,17,20,23,30,32 then:
This filter compares ticket with other tickets in a selected file. The filter accepts a ticket if it matches tickets from the file in selected count of numbers.
To use the filter, first click Browse button to browse for the file with tickets to be compared with filtered tickets. Then tick the desired matching combinations in the table below. The match file can be either in binary or text format.
Let's assume we want to compare filtered tickets with the following ticket file:
This filter compares ticket numbers with numbers in a selected text file. The filter accepts a ticket if it contains selected count of numbers from that file.
To use the filter, first click Select button to browse for the text file with numbers to be compared with filtered tickets. Then tick the desired count(s) of matching numbers in the table below.
The file with matching numbers must follow these formatting rules:
Let's assume we want to compare filtered tickets with the following file:
01,02,03,04
01,02,03,05
01,02,03,20
20,21,22,30,31
40,41,42,43
This filter is similar to Match Numbers in File filter - it compares ticket's first/last digits with numbers in a selected text file. The filter accepts a ticket if it contains selected count of digits from that file.
To use the filter, first click Select button to browse for the text file with numbers to be compared with filtered tickets. Then tick the desired count(s) of matching digits in the table below.
The file with matching numbers must follow these formatting rules:
Let's assume we want to compare filtered tickets with the following file:
2,3
1,1,1,2,3
3,4,6,8,9
8,9,1
This filter checks the standard deviation of ticket's main numbers. Standard deviation is a mathematical formula, which evaluates how close are the ticket numbers to each other. Low standard deviation values mean that ticket numbers are very close to each other in the number pool. High standard deviation values mean that ticket numbers are from different parts of number pool.
Ticket numbers 1-2-3-4-5-6 have standard deviation of 1.87. The value is low because all numbers come from the same section of number pool. The same applies to ticket numbers 44-45-46-47-48-49 which have also standard deviation of 1.87.
Ticket numbers 6-9-15-18-33-43 have standard deviation of 14.43 because the numbers come from various parts of number pool.
See also Standard Deviation statistical property.
This filter accepts tickets that have their index within specified range. Ticket index is a number which uniquely identifies the ticket in the set of all possible number combinations. For example in 6/49 lottery, the ticket index 1 is equal to number combination 1-2-3-4-5-6, ticket index 2 equals to number combination 1-2-3-4-5-7, ticket index 3 is number combination 1-2-3-4-5-8 etc. Ticket numbers 44-45-46-47-48-49 have ticket index of 13,983,816.
To use the filter, select the minimum allowed ticket index value (inclusive) and the maximum allowed ticket index value (inclusive).
See also Ticket Index Movement filter, Ticket Index statistical property and Ticket Index Range summary statististics.
This filter accepts tickets if their numbers fall into selected number groups. To use the filter, first select number groups set you wish to filter with in Number Groups combo box. Then tick number groups you wish to use and specify how many ticket numbers should be in each group.
Button Customize opens number groups customizer where you can adjust the settings of currently selected numbers groups. Note: All customizations are temporary only and apply to current filter only. To make permanent changes in number groups settings, use menu Tools - Number Groups.
Button Toggle all groups ticks or unticks all number group check boxes in the table above it.
The default number groups set in Expert Lotto 6/49 Demo Lottery divides pool numbers into five groups: 1-10, 11-20, 21-30, 31-40, 41-49.
The filter accepts tickets that have the desired count of consecutive numbers. Numbers are consecutive if each number is one higher than the preceding number. For example numbers 5,6,7 are consecutive, numbers 5,8,11 aren't consecutive.
Important: Number combinations like 15-16-17-18-20-23 are always interpreted as four consecutive numbers, such number combinations are never treated as two pairs of consecutive numbers or one triplet of consecutive numbers.
The
filter accepts tickets that have the desired count of consecutive first or last digits. Each pool number breaks down into two
digits. The first digit is the leading digit of the number, the last
digit is the second digit of the number. For example the first digit of number
23 is 2, the last digit of that number is 3. The first digit of number
9 is 0, the last digit of that number is 9.
Digits are consecutive if each digit is one higher than the
preceding digit. For example digits 5,6,7 are consecutive, digits 5,7,9 aren't consecutive.
Important: Last digit sequences like 15-16-17-18-20-23 are always interpreted as four consecutive digits (5,6,7,8), such combinations are never treated as two pairs of consecutive digits or one triplet of consecutive digits. The same applies to first digits.
See also Consecutive Numbers filter.
This filter accepts tickets that have the desired count of first/last digits that are consecutive regardless of their order.
Each pool number breaks down into two
digits. The first digit is the leading digit of the number, the last
digit is the second digit of the number. For example the first digit of number
23 is 2, the last digit of that number is 3. The first digit of number
9 is 0, the last digit of that number is 9.
Digits are consecutive if each digit is one higher than the
preceding digit. For example digits 5,6,7 are consecutive, digits 5,7,9 aren't consecutive.
See also Consecutive First/Last Digits In Any Order statistics and Consecutive Digits ticket filter.
This filter accepts tickets that contain selected pairs of consecutive numbers. A pair of numbers is consecutive if the second number in the pair is one higher then the first pair number. For example number pair 5-6 is consecutive, number pair 5-7 is not consecutive.
To use this filter, first select the desired consecutive pairs in the table then choose how many selected pairs each ticket must have to be accepted by the filter. For example in a 6/xx lottery there can be up to 3 pairs of consecutive numbers in a single ticket, e.g. 1-2-4-5-7-8.
![]() You can tick/untick multiple consecutive pairs with a single
mouse click - first highlight the desired pairs with your mouse then
click any of the highlighted pairs.
You can tick/untick multiple consecutive pairs with a single
mouse click - first highlight the desired pairs with your mouse then
click any of the highlighted pairs.
Note: Number combinations like 1-2-3-4-10-15 are interpreted as one instance of four consecutive numbers, it is never evaluated as two pairs of consecutive numbers.
Filtering with settings Select Pairs: 1-2, 2-3, 3-4, 4-5, 5-6, 7-8, 8-9, 9-10, 10-11, Minimum count in a ticket: 2, maximum: 2 accepts for example ticket 1-4-5-9-10-37 as it contains two of the selected pairs: 4-5 and 9-10. However the filter rejects tickets like 1-2-5-6-9-10 because it contains three selected pairs and the allowed maximum is 2. The same filter also rejects tickets like 1-2-3-4-20-30 as it contains a consecutive quad and not the required two consecutive pairs.
See also Consecutive Pairs statistics.
This filter accepts tickets that contain selected triplets of consecutive numbers. A triplet of numbers is consecutive if each number is one higher than the preceding one. For example number triplet 5-6-7 is consecutive, number triplet 5-6-8 is not consecutive.
To use this filter, first selected the desired consecutive triplets in the table then choose how many selected triplets each ticket must have to be accepted by the filter. For example in a 6/xx lottery there can be up to 2 triplets of consecutive numbers in a single ticket, e.g. 1-2-3-5-6-7.
![]() You can tick/untick multiple consecutive triplets with a
single
mouse click - first highlight the desired triplets with your mouse then
click any of the highlighted triplets.
You can tick/untick multiple consecutive triplets with a
single
mouse click - first highlight the desired triplets with your mouse then
click any of the highlighted triplets.
Note: Number combinations like 1-2-3-4-5-6 are interpreted as one instance of six consecutive numbers, it is never evaluated as two triplets of consecutive numbers.
Filtering with settings Select Triplets: 1-2-3, 5-6-7, Minimum count in a ticket: 1, maximum: 1 accepts for example ticket 5-6-7-10-20-30 as it contains the selected triplet: 5-6-7 or ticket 5-6-7-10-11-12.
Filtering with settings Select Triplets: 1-2-3, 5-6-7, Minimum count in a ticket: 2, maximum: 2 accepts only a single ticket: 1-2-3-5-6-7. There are no other ticket matching such filter settings.
See also Consecutive Triplets statistics.
This filter accepts tickets that contain selected quads of consecutive numbers. A quad of numbers is consecutive if each number is one higher than the preceding one. For example number quad 5-6-7-8 is consecutive, number quad 5-6-7-9 is not consecutive.
To use this filter, first select the desired consecutive quads in the table then choose how many selected quads each ticket must have to be accepted by the filter. For example in a 6/xx lottery there can be only a single quad of consecutive numbers in a single ticket, e.g. 1-2-3-4-6-7. In a 10/xx Keno lottery there can be up to two quads of consecutive numbers in a single ticket, e.g. 1-2-3-4-6-7-8-9-11-12.
![]() You can tick/untick multiple consecutive quads with a
single
mouse click - first highlight the desired quads with your mouse then
click any of the highlighted quads.
You can tick/untick multiple consecutive quads with a
single
mouse click - first highlight the desired quads with your mouse then
click any of the highlighted quads.
Note: Number combinations like 1-2-3-4-5-6 are interpreted as one instance of six consecutive numbers, it is never evaluated as a quad of consecutive numbers.
Filtering with settings Select Quads: 1-2-3-4, 2-3-4-5, Minimum count in a ticket: 1, maximum: 1 accepts for example ticket 1-2-3-4-6-7 or ticket 2-3-4-5-7-8. The filter rejects for example ticket 1-2-3-4-5-7 because it contains five consecutive numbers instead of the desired four.
See also Consecutive Quads statistics.
This filter selects tickets according to the layout of their numbers in number grid on paper playslip. The filter accepts tickets that have given maximum count of numbers in a single row of the number grid and/or the given count of numbers in a single column of the number grid.
To use the filter, first check whether you want to filter the count of numbers in a panel's row or in panel's column or both. Then enter the minimum and maximum count of ticket numbers in panel's row or column respectively.
The number grid in Expert Lotto 6/49 lottery looks like this:
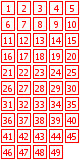
See also Ticket Panel statistics.
The filter compares the differences of ticket numbers at neighboring ticket positions. For example in a ticket 1-10-15-18-34-40 the neighboring numbers are 1 and 10, their distance is 10-1=9. Another pair of neighbors are 10 and 15, their distance is 15-10=5. Other neighboring numbers are 15 and 18, 18 and 34 and 34 and 40.
Filtering with settings 5 to 5 neighboring numbers have distance of 1 to 1 accepts only tickets like 1-2-3-4-5-6 as the difference of all five neighboring pairs is one.
Filtering with settings 2 to 3 neighboring numbers have distance of
5 to 10 accepts for example ticket 5-8-21-28-33-42 because neighbors 21
and 28, 28 and 33 and 33 and 42 have the distance in the range of 5 to
10. However, for example ticket 3-8-21-28-33-42 is rejected because
there are four neighboring pairs of numbers with the distance in the
given range.
This filter evaluates the difference between ticket numbers at selected ticket positions. The filter accepts a ticket if the difference of at least one or all numbers at selected neighboring positions is within given range.
Note: In a 6/xx lottery the filter settings The maximum difference of every 6 neighboring numbers is X to Y is equal to filter settings The maximum difference of any 6 neighboring numbers is X to Y.
This filter accepts only tickets that contain specified first/last digits. Each pool number breaks down into two digits. The first digit is the leading digit of the number, the last digit is the second digit of the number. For example the first digit of number 23 is 2, the last digit of that number is 3. The first digit of number 9 is 0, the last digit of that number is 9.
Note: In a x/49 lottery there is no number with the first digit 5, 6, 7, 8 or 9 because all pool numbers are lower than 50. So the highest possible first digit for that lottery type is 4.
This filter accepts tickets that have selected count of repeating first or last digits. Each pool number breaks down into two digits. The first digit is the leading digit of the number, the last digit is the second digit of the number. For the first digit of number 23 is 2, the last digit of that number is 3. The first digit of number 9 is 0, the last digit of that number is 9.
The filter accepts tickets that have the desired count of first or last digits. The first digit is the leading digit of the number, the last digit is the second digit of the number. For example the first digit of number 23 is 2, the last digit of that number is 3. The first digit of number 9 is 0, the last digit of that number is 9.
Note: In a x/49 lottery there is no number with the first digit 5, 6, 7, 8 or 9 because all pool numbers are lower than 50. So the highest possible first digit for that lottery type is 4.
The filter accepts tickets that have Arithmetic Complexity value in selected range.
See also Arithmetic Complexity statistics.
This filter accepts tickets with selected bonus or powerball numbers. To use the filter, select the bonus number(s) you wish to filter on the ticket panel using your mouse.
Note: This filter is available only for Powerball-like lotteries, which draw one or more bonus numbers from a separate pool.
When filter settings are Bonus Numbers: 1, 3, 5 then
This filter compares filtered tickets with selected past winning numbers draws.
The latest five draws in Expert Lotto 6/49 Demo Lottery are:
2010/27, Sun 2nd, 01-06-12-24-32-41-[44]
2010/28, Wed 1st, 16-18-22-23-28-29-[24]
2010/28, Wed 2nd, 02-13-16-17-25-40-[27]
2010/28, Sun 1st, 06-13-14-19-41-42-[29]
2010/28, Sun 2nd, 23-29-36-42-44-47-[07]
Filtering with settings Winning Numbers: 5 latest draws, Match 4 accepts for example ticket 1-6-12-15-24-42 as it matches draw 2010/27 Sun 2nd in four numbers (1,6,12,24). Filter rejects for example ticket 23-30-36-42-44-47 as it matches five numbers from draw 2010/28 Sun 2nd.
Filtering with settings Winning Numbers: 5 latest draws, Match 3, Min 2 accepts for example ticket 13-14-16-19-35-40 as it matches 3 numbers from draw 2010/28 Wed 2nd and three numbers from draw 2010/28 Sun 1st.
See also Match Previous Draws statistics.
This filter accepts tickets that have selected count of same first or last digits as selected past draws.
Each pool number breaks down into two digits. The first digit is the leading digit of the number, the last digit is the second digit of the number. For example the first digit of number 23 is 2, the last digit of that number is 3. The first digit of number 9 is 0, the last digit of that number is 9.
The latest five draws in Expert Lotto 6/49 Demo Lottery are:
2010/27, Sun 2nd, 01-06-12-24-32-41-[44]
2010/28, Wed 1st, 16-18-22-23-28-29-[24]
2010/28, Wed 2nd, 02-13-16-17-25-40-[27]
2010/28, Sun 1st, 06-13-14-19-41-42-[29]
2010/28, Sun 2nd, 23-29-36-42-44-47-[07]
Filtering with settings Winning Numbers: 5 latest draws, Match last digits min: 6, max: 6 accepts for example ticket 1-2-3-4-6-9 because it has the same last digits as draw 2010/28, Sun 1st (note that the digits don't have to match at the same ticket positions). The same settings accepts also ticket e.g. 1-6-22-24-31-42 because its last digits are the same as in draw 2010/27, Sun 2nd. The filter rejects for example ticket 1-2-3-4-5-6 because none of the selected past draws has the same last digits.
Filtering with settings Winning Numbers: 1 latest draw, Match last digits min: 3, max: 6 accepts all tickets that have at least three same last digits as the latest draw 2010/28, Sun 2nd. That means at least three digits from 2, 3, 4, 6, 7 or 9.
See also Match Winning Numbers filter.
This filter accepts tickets that have selected count of bonus numbers matching from selected past draws.
The filter is available only for lotteries that draw one or more bonus number from the same pool as the main numbers - Jackpot-like lotteries.
The latest five draws in Expert Lotto 6/49 Demo Lottery are:
2010/27, Sun 2nd, 01-06-12-24-32-41-[44]
2010/28, Wed 1st, 16-18-22-23-28-29-[24]
2010/28, Wed 2nd, 02-13-16-17-25-40-[27]
2010/28, Sun 1st, 06-13-14-19-41-42-[29]
2010/28, Sun 2nd, 23-29-36-42-44-47-[07]
Filtering with settings Winning Numbers: 5 latest draws, Match bonus min: 3, max: 3 accepts tickets that contain exactly 3 bonus numbers from the latest 5 draw. That means tickets that contain exactly three numbers from 44, 24, 27, 29, 7, for example ticket 1-2-3-7-24-27. The filter rejects for example ticket 1-2-7-24-27-29 because it contains four bonus numbers from the latest 5 draws which is outside the allowed range.
See also Match Winning Numbers filter.
This filter is similar to Match Winning Numbers filter as it also compares the filtered tickets with selected past draws. Filter accepts a ticket if it matches the selected past draws. For example if Match 4 is selected in the filter window then the filter accepts all tickets that match any of selected past draws in four numbers. However the accepted ticket cannot match other selected draws in five or six numbers (unlike the Match Winning Numbers filter where this is allowed).
The latest five draws in Expert Lotto 6/49 Demo Lottery are:
2010/27, Sun 2nd, 01-06-12-24-32-41-[44]
2010/28, Wed 1st, 16-18-22-23-28-29-[24]
2010/28, Wed 2nd, 02-13-16-17-25-40-[27]
2010/28, Sun 1st, 06-13-14-19-41-42-[29]
2010/28, Sun 2nd, 23-29-36-42-44-47-[07]
Filtering with settings Winning Numbers: 5 latest draws, Match 2 accepts for example ticket 1-2-3-4-5-6 as it matches draw 2010/27
Sun 2nd in two numbers (1,6) and there is no higher match with any other draw.
Filter rejects for example ticket 1-12-24-47-48-49 because it matches draw 2010/27
Sun 2nd in three numbers and only match 2 is allowed in filter condition.
Filter also rejects for example ticket 6-14-25-36-39-41. The ticket does match draw 2010/27
Sun 2nd in two numbers however there is also higher match in three numbers with draw 2010/28 Sun 1st (numbers 6,14,41).
Filtering with settings Winning Numbers: 5 latest draws, Match 6 accepts only tickets that have the same numbers as the latest 5 draws. The filtering results are then the same as when using Match Winning Numbers filter with the same settings.
See also Match Previous Draws statistics and Match Winning Numbers filter.
This filter accepts tickets that have selected count of hot and cold numbers. Numbers are hot when they have been drawn very frequently in the last few draws, cold numbers are those which haven't been drawn at all or only once or twice in the last few draws.
When filter settings are Winning Numbers: 20 latest draws, Hot numbers: 1 to 2, Cold numbers 1 to 2, Hot number must hit at least 4 times, Cold number can hit at most 1 times then:
When filter settings are Winning Numbers: 20 latest draws, Hot numbers: 6 to 6, Cold numbers 0 to 0, Hot number must hit at least 4 times, Cold number can hit at most 1 times then:
When filter settings are Winning Numbers: 20 latest draws, Hot numbers: 4 to 4, Cold numbers 4 to 4, Hot number must hit at least 4 times, Cold number can hit at most 1 times then the filter will reject all tickets. There are only 6 numbers in each ticket and a ticket number cannot be hot and cold at the same time.
See also Hot/Cold Numbers statistics and Hot/Cold Numbers coloring.
This filter compares the ticket index of filtered tickets with the index of the latest past winning numbers draw. The filter accepts tickets that have given distance from the selected latest draw in the list of all possible combinations. The lowest possible ticket index movement value is 0.0 meaning that the ticket numbers are the same as in the latest draw. The highest possible value is 0.999999999. This happens only if ticket numbers are 1-2-3-4-5-6 and the latest winning numbers are 44-45-46-47-48-49 or vice versa (applies to 6/49 lottery).
To use the filter, first select past winning number draws to compare filtered tickets with. Please note that only the very latest draw from the selected draws is used when calculating ticket index movement. Then enter the desired range for ticket index movement value.
Note: The number of decimal places in input fields depends on the number of decimal places selected in Options window.
When filter settings are Winning Numbers: 10 latest draws, Ticket index movement min: 0.0001, max: 0.0002 then the filtered tickets are being compared with the latest draw 2010/28 Sun 2nd. The winning numbers for that draw are 23-29-36-42-44-47-[7] and their ticket index is 13,737,320.
See also Ticket Index Range filter and Ticket Index Movement statistical property.
This
filter is very similar to Ticket Index Movement filter except that this filter makes difference between negative ticket index movement and positive ticket index movement. A ticket has positive index movement when its numbers are higher than the numbers of the latest selected draw. Negative ticket index movement means ticket numbers are lower than the number of the latest selected draw.
The lowest possible positive ticket index movement value
is 0.0 meaning that the ticket numbers are the same as in the latest
draw. The highest possible positive ticket index movement value is 0.999999999. This happens only if ticket
numbers are 44-45-46-47-48-49 and the latest winning numbers are
1-2-3-4-5-6 (applies to 6/49 lottery).
The lowest possible negative ticket index movement value
is -0.999999999. This happens only if ticket
numbers are 1-2-3-4-5-6 and the latest winning numbers are
44-45-46-47-48-49 (applies to 6/49 lottery). The highest possible negative ticket index value is 0.0 meaning that the ticket numbers are the same as in the latest
draw.
To use the filter, first select past winning number draws to compare filtered tickets with. Please note that only the very latest draw from the selected draws is used when calculating ticket index movement. Then enter the desired range for positive ticket index movement value and the desired range for negative ticket index movement value.
Note: The number of decimal places in input fields depends on the number of decimal places selected in Options window.
When filter settings are Winning Numbers: 10 latest draws, Positive ticket index movement min: 0.01, max: 0.02, Negative ticket index movement min: -0.01, max: -0.02 then the filtered tickets are being compared with the latest draw 2010/28 Sun 2nd. The winning numbers for that draw are 23-29-36-42-44-47-[7] and their ticket index is 13,737,320.
See also Ticket Index Movement filter and Ticket Index Movement statistical property.
This
filter evaluates individual digits (or positions) in the ticket index value of filtered tickets. Ticket index is a number which uniquely identifies the ticket in the
set of all possible number combinations. For example in 6/49 lottery,
the ticket index 1 is equal to number combination 1-2-3-4-5-6, ticket
index 2 equals to number combination 1-2-3-4-5-7, ticket index 3 is
number combination 1-2-3-4-5-8 etc. Ticket numbers 44-45-46-47-48-49
have ticket index of 13,983,816.
That means there are 8 positions the filter can work with. The digits in ticket index 1 are 0, 0, 0, 0, 0, 0, 0 and 1 and digits in ticket index 13,983,816 are 1,3,9,8,3,8,1 and 6.
When filter settings are Position 8: 3, 4, At least 1 to 1 positions must pass then the filter will select tickets that have ticket index value ending with 3 or 4. For example ticket 1-2-3-4-5-8 with ticket index value of 3 or 12-27-35-38-40-47 with ticket index value Ticket Index 11,631,494.
See also Ticket Index Range filter and Ticket Index Positions statistics
This filter accepts tickets that contain selected count of numbers that repeat from past winning numbers draws.
The latest five draws in Expert Lotto 6/49 are:
2010/27 Sun 2nd, 01-06-12-24-32-41-[44]
2010/28 Wed 1st, 16-18-22-23-28-29-[24]
2010/28 Wed 2nd, 02-13-16-17-25-40-[27]
2010/28 Sun 1st, 06-13-14-19-41-42-[29]
2010/28 Sun 2nd, 23-29-36-42-44-47-[07]
So the draw numbers from the last five draws are: 1,2,6,12,13,14,16,18,19,22,23,24,25,28,29,32,36,40,41,42,44 and 47.
When filter settings are Winning Numbers: 5 latest draws, Min: 3, Max: 3 then:
See also Repeating Numbers statistics.
This filter accepts tickets that contain selected count of first or last digits that repeat from past winning numbers draws.
The latest two draws in Expert Lotto 6/49 Demo Lottery are:
2010/28 Sun 1st, 06-13-14-19-41-42-[29]
2010/28 Sun 2nd, 23-29-36-42-44-47-[07]
So the last digits from the latest two draws are: 1,2,3,4,6,7 and 9.
When filter settings are Winning Numbers: 2 latest draws, Min: 3, Max: 3 then:
See also Repeating Numbers filter.
The filter accepts tickets that have desired count of numbers that are adjacent to the numbers of the latest draw. A number is adjacent to some other number if it is one lower or one higher than the other number.
Optionally it is possible to adjust the distance of adjacent numbers using +/-1 to +/-5 check boxes. For example selecting option +/-4 means that a number will be adjacent to some other number if it is greater by 4 or lower by 4 than that other number.
Note: The filter compares the numbers of filtered tickets with the numbers of the latest draw within the past draws selected in filter window. So selecting for example Winning Numbers: All draws and Winning Numbers: 10 latest draws in Expert Lotto 6/49 Demo lottery has the same effect, the adjacent numbers will be compared to the very latest draw which is 2010/28 Sun 2nd.
The latest draw in Expert Lotto 6/49 Demo Lottery is:
2010/28, Sun 2nd, 23-29-36-42-44-47-[07]
Filtering with settings Winning Numbers: All draws, Adjacent numbers: +/-1, min: 2 max: 4 accepts for example ticket 1-2-3-4-22-24. The last two numbers of that ticket are adjacent to number 23 in the latest draw.
Filter rejects for example ticket 24-30-37-43-45-48 because all its numbers are adjacent to the winning numbers from the latest draw and the filter condition allows 4 such numbers at most.
Filtering with settings Winning Numbers: All draws, Adjacent numbers: +/-1, min: 2 max: 4, Match ticket positions, accepts for example ticket 1-2-3-4-43-46. The last two numbers of that ticket are adjacent to numbers 44 and 47 respectively in the latest draw at the same ticket positions.
Filter rejects for example ticket 1-2-3-4-22-24 because even though it does contain two adjacent numbers 22 and 24, those numbers are not at the same ticket positions as in the latest draw.
Filtering with settings Winning Numbers: All draws, Adjacent numbers: +/-5, min: 6 max: 6, Match ticket positions, accepts only a single ticket 18-24-31-37-39-42. All its numbers are greater or lower by 5 when compared with the winning numbers of the latest draw at the same ticket positions.
Filtering with settings Winning Numbers: All draws, Adjacent numbers: +/-2, +/-5, min: 3 max: 3, Match ticket positions, accepts for example ticket 1-2-3-37-39-45. Numbers 37 and 39 are lower by five than numbers 42 and 44 at appropriate ticket position in the latest draw. The last number 45 is lower by two than the last number 47 in the latest draw. That is exactly three such numbers as specified in filter condition.
Filter rejects for example ticket 1-2-3-37-39-44 because the distance between its last number 44 and number 47 from the latest draw is -3. The filter condition allows only distance +/-2 or +/-5.
See also Adjacent Numbers statistics and Adjacent Digits filter.
The filter accepts tickets that have the desired count of first or last digits that are adjacent to the digits of the latest draw. A digit is adjacent to some other digit if it is one higher or one lower than the other digit.
Note: The filter compares the digits of filtered tickets with the digits of the latest draw within the past draws selected in filter window. So selecting for example Winning Numbers: All draws and Winning Numbers: 10 latest draws in Expert Lotto 6/49 Demo lottery has the same effect, the adjacent digits will be compared to the very latest draw which is 2010/28 Sun 2nd.
The latest draw in Expert Lotto 6/49 Demo Lottery is:
2010/28, Sun 2nd, 23-29-36-42-44-47-[07]
Filtering with settings Winning Numbers: All draws, Adjacent Last digits min: 2 max: 4 accepts for example ticket 1-2-3-4-9-10. The last digit of number 1 is adjacent to number 42 from the latest draw. The last digit of number 2 is adjacent to number 23 of the latest draw. The last digit of number 3 is adjacent to numbers 42 and 44 of the latest draw. That is 3 adjacent last digits in total.
Filter rejects for example ticket 1-2-3-4-5-6 because all its last digits are adjacent to the last digits of the latest draw and the filter condition allows at most 4 such digits.
Filtering with settings Winning Numbers: All draws, Adjacent Last digits min: 2 max: 4, Match ticket position accepts for example ticket 1-2-5-9-10-16. The last digit of number 5 is adjacent to number 36 at the same position in the latest draw. And the last digit of number 16 is adjacent to the last digit of number 47 from the previous draw. That is 2 adjacent last digits in total.
Filter rejects for example ticket 1-2-3-4-9-10 because no last digit is adjacent to the last digits of the latest draw when comparing by ticket position.
See also Adjacent Digits statistics and Adjacent Numbers filter.
The filter accepts tickets that have selected count of numbers that made chess-like knight's move when compared with the latest draw. Please refer to Knight's Move statistics to see what knight's move mean.
To use this filter, first select past draws to compare the filter tickets with. Then choose how many numbers must make the L-shaped knight's move in accepted tickets.
Note: The filter compares the numbers of filtered tickets with the numbers of the latest draw within the past draws selected in filter window. So selecting for example Winning Numbers: All draws and Winning Numbers: 10 latest draws in Expert Lotto 6/49 Demo lottery has the same effect, the filtered numbers will be compared to the very latest draw which is 2010/28 Sun 2nd.
The latest draw in Expert Lotto 6/49 Demo Lottery is:
2010/28, Sun 2nd, 23-29-36-42-44-47-[07]
Filtering with settings Winning Numbers: 1 latest draw, Knight's move numbers min: 6 max: 6 accepts for example ticket 2-4-8-10-11-15 because all its numbers made knight's move jump when compared with the latest draw. 2 -> 23, 4 -> 23, 8 -> 29, 10 -> 29, 11 -> 23, 15 -> 36.Filtering with settings Winning Numbers: 1 latest draw, Knight's move numbers min: 6 max: 6, Match ticket positions accepts for example ticket 2-8-15-21-23-26 because all its numbers made knight's move jump when compared with the winning numbers of the latest draw at the same ticket positions. 2 -> 23, 8 ->
29, 15 -> 36, 21 -> 42, 23 -> 44, 26 -> 47.
Filter rejects for example ticket 2-4-8-10-11-15. Its numbers did make knight's move when compared to the latest winning numbers however the ticket positions do not match.
See also Knight's Move statistics.
The filter accepts tickets that have the same pattern of number movement as any of the selected past winning numbers draws. The movement pattern of filtered tickets is calculated by comparing its numbers with the latest winning numbers of selected draws.
The latest three draws in Expert Lotto 6/49 Demo lottery are:
| Draw | Number Movement Pattern | |||||||
| 2010/28 Sun 2nd | 23 | 29 | 36 | 42 | 44 | 47 | [07] | ++++++ |
| 2010/28 Sun 1st | 06 | 13 | 14 | 19 | 41 | 42 | [29] | +=-+++ |
| 2010/28 Wed 2nd | 02 | 13 | 16 | 17 | 25 | 40 | [27] | -----+ |
When filter settings are Winning Numbers: 3 latest draws then filter accepts for example ticket 1-2-3-4-5-48. When compared with the latest draw 2010/28 Sun 2nd its last number movement pattern is -----+ which does match one of the selected draws (2010/28 Wed 2nd). The filter also accepts for example ticket 24-30-37-43-45-48. All its numbers are greater than numbers in draw 2010/28 Sun 2nd so its movement pattern is ++++++ which matches selected draw 2010/28 Sun 2nd.
Filter rejects for example ticket 22-28-35-41-43-46 because its movement pattern is ------ (comparing with the latest selected draw 2010/28 Sun 2nd) which does not match the pattern of any of the selected past draws.
When filter settings are Winning Numbers: 1 latest draw, then filter accepts only tickets that have all their numbers greater than numbers in draw 2010/28 Sun 2nd. For example ticket 24-30-37-43-45-48.
See also Number Movement Patterns statistics.
This filter compares ticket numbers at selected neighboring positions and selects tickets where the difference between such numbers is within selected interval.
When filter settings are Positions 3-2, Min distance 1, Max distance 1, At least 1 to 1 positions must pass then filter will select tickets where number at the third position is one higher than the number at the second position, for example 5-22-23-27-28-49 or 13-15-16-20-26-35
When filter settings are Positions 1-0, Min distance 1, Max distance 10, At least 1 to 1 positions must pass then filter will select tickets where the first number is from the range 1 to 10.
See also Neighbors Distance filter.
The filter accepts tickets that have the same first/last digits as any of selected past winning numbers draws. The first digit is the leading digit of the number, the last digit is the second digit of the number. For example the first digit of number 23 is 2, the last digit of that number is 3. The first digit of number 9 is 0, the last digit of that number is 9.
The latest three draws in Expert Lotto 6/49 Demo lottery are:
| 2010/28 Sun 2nd | 23 | 29 | 36 | 42 | 44 | 47 | [07] |
| 2010/28 Sun 1st | 06 | 13 | 14 | 19 | 41 | 42 | [29] |
| 2010/28 Wed 2nd | 02 | 13 | 16 | 17 | 25 | 40 | [27] |
When filter settings are Winning Numbers: 3 latest draw, Last Digits, At least 6 to 6 positions must pass then filter accepts for example ticket 12-13-16-17-25-30. Its last digits are 2-3-6-7-5-0 so there is a match with selected draw 2010/28 Wed 2nd.
Filter rejects for example ticket 12-13-16-17-25-31 because only five last digits are the same as in draw 2010/28 Wed 2nd and there is no match with any other selected draw.
When filter settings are Winning Numbers: 3 latest draw, Last Digits, At least 3 to 3 positions must pass then filter accepts for example ticket 12-13-16-17-21-22. Its three numbers 13, 21 and 22 have the same last digits as numbers of draw 2010/28 Sun 1st. So the ticket is accepted even though it has four matching last digits when compared with draw 2010/28 Wed 2nd.
Filter rejects for example ticket 12-13-16-17-25-30 because all six last digits are the same as in draw 2010/28 Wed 2nd and there is no match in three digits with any other selected draw.
The filter accepts tickets that have the same pattern of movement of first/last digits as any of the selected past winning numbers draws. The movement pattern of filtered tickets is calculated by comparing its digits with the digits of the latest selected draw.
The latest three draws in Expert Lotto 6/49 Demo lottery are:
| Draw | First Digit Pattern | Last Digit Pattern | |||||||
| 2010/28 Sun 2nd | 23 | 29 | 36 | 42 | 44 | 47 | [07] | ++++== | -++-++ |
| 2010/28 Sun 1st | 06 | 13 | 14 | 19 | 41 | 42 | [29] | ====+= | +=-+-+ |
| 2010/28 Wed 2nd | 02 | 13 | 16 | 17 | 25 | 40 | [27] | -=--=+ | --++-- |
When filter settings are Winning Numbers: 3 latest draws, Last digits then filter accepts for example ticket 1-2-7-8-10-11. When compared with the latest draw 2010/28 Sun 2nd its last digit movement pattern is --++-- which does match one of the selected draws (2010/28 Wed 2nd). The filter also accepts for example ticket 28-29-35-39-43-49. When compared with the latest draw 2010/28 Sun 2nd its last digit movement pattern is +=-+-+ which matches selected draw 2010/28 Sun 1st.
Filter rejects for example ticket 1-2-3-4-5-6 because the pattern of last digits is ---++- (comparing with the latest selected draw 2010/28 Sun 2nd) which does not match the pattern of any of the selected past draws.
When filter settings are Winning Numbers: 3 latest draws, First digits then filter rejects all tickets. Looking at the table above we can see that in all three selected past draws the movement pattern mandates one first digit greater than 4. However that is not possible in a x/49 lottery.
When filter settings are Winning Numbers: 1 latest draw, Last digits then filter rejects all tickets. The last digit at the second ticket position is 9 and the movement pattern requires greater last digit at that position. However there is no last digit greater than 9.
See also Digits Movement Patterns statistics.
The filter accepts tickets that have the same pattern of distribution of numbers into selected number groups as any of the selected past winning numbers draws.
The latest three draws in Expert Lotto 6/49 Demo lottery are:
| Draw | Number Groups Distribution | |||||||
| 2010/28 Sun 2nd | 23 | 29 | 36 | 42 | 44 | 47 | [07] | 0-0-2-1-3 |
| 2010/28 Sun 1st | 06 | 13 | 14 | 19 | 41 | 42 | [29] | 1-3-0-0-2 |
| 2010/28 Wed 2nd | 02 | 13 | 16 | 17 | 25 | 40 | [27] | 1-3-1-1-0 |
Note: The table above shows the patterns for the default range numbers groups 1-10, 11-20, 21-30, 31-40, 41-49.
When filter settings are Winning Numbers: 3 latest draws, Number Groups: Default then filter accepts for example ticket 1-11-12-13-21-31. The distribution of its numbers into the default number groups is 1-3-1-1-0 which does match one of the selected draws (2010/28 Wed 2nd). The filter also accepts for example ticket 23-26-37-42-44-46. Its number groups distribution is 0-0-2-1-3 which matches selected draw 2010/28 Sun 2nd. Another accepted ticket is for example 6-13-14-19-41-42. It has the same numbers as one of the selected draws (2010/28 Sun 1st) so it has also the same number groups distribution 1-3-0-0-2.
Filter rejects for example ticket 1-2-3-4-5-6 because its number groups distribution is 6-0-0-0-0-0 which does not match any of the selected past draws.
See also Number Groups statistics.
The filter rejects tickets that have one ore more numbers from five groups of selected past draws.
Note: The filter requires at least 16 past winning numbers draws. If there are less draws selected in the filter window then the filter accepts all tickets.
The latest 16 draws in Expert Lotto 6/49 Demo lottery are:
| 2010/28 Sun 2nd | 23 | 29 | 36 | 42 | 44 | 47 | [07] | |
| 2010/28 Sun 1st | 06 | 13 | 14 | 19 | 41 | 42 | [29] | Group A |
| 2010/28 Wed 2nd | 02 | 13 | 16 | 17 | 25 | 40 | [27] | |
| 2010/28 Wed 1st | 16 | 18 | 22 | 23 | 28 | 29 | [24] | |
| 2010/27 Sun 2nd | 01 | 06 | 12 | 24 | 32 | 41 | [44] | Group B |
| 2010/27 Sun 1st | 02 | 15 | 22 | 29 | 30 | 37 | [42] | |
| 2010/27 Wed 2nd | 20 | 23 | 25 | 30 | 33 | 35 | [07] | |
| 2010/27 Wed 1st | 08 | 11 | 19 | 26 | 48 | 49 | [18] | Group C |
| 2010/26 Sun 2nd | 08 | 11 | 18 | 32 | 36 | 38 | [06] | |
| 2010/26 Sun 1st | 05 | 06 | 11 | 31 | 40 | 43 | [32] | |
| 2010/26 Wed 2nd | 04 | 18 | 26 | 33 | 35 | 47 | [11] | |
| 2010/26 Wed 1st | 05 | 12 | 25 | 31 | 44 | 46 | [33] | Group D |
| 2010/25 Sun 2nd | 10 | 15 | 28 | 30 | 36 | 43 | [35] | |
| 2010/25 Sun 1st | 16 | 21 | 24 | 25 | 35 | 46 | [47] | |
| 2010/25 Wed 2nd | 09 | 12 | 23 | 34 | 39 | 49 | [24] | Group E |
| 2010/25 Wed 1st | 01 | 06 | 22 | 24 | 34 | 40 | [33] |
The filter rejects ticket if it contains any number which is listed in groups B or E and which at the same time is not listed in groups A or C.
Winning numbers in groups A and C are: 2,5,6,7,8,11,13,14,16,17,18,19,20,23,25,26,27,29,30,31,32,33,35,36,38,40,41,42,43,44,47,48,49
Winning numbers in groups B and E are: 1,2,6,9,12,15,16,18,21,22,23,24,25,28,29,30,32,33,34,35,37,39,40,41,42,44,46,47,49
Numbers listed in groups B and E and not listed in groups A and C are: 1,9,12,15,21,22,24,28,34,37,39,46. So the filter rejects all tickets that contain one or more of these numbers.
For example filter accepts ticket 2-3-4-5-6-7 or 8-13-32-36-48-49. The filter rejects for example ticket 1-2-3-4-5-6 because its number 1 is listed in the group above. Also ticket 8-13-34-39-48-49 because its numbers 34 and 39 are listed in the group above.
This filter accepts tickets that have the same distribution of numbers into ranges of the latest draw as any of selected past draws.
Winning numbers of each draw divide the number pool into six consecutive ranges (applies to 6/xx lottery). If the latest winning numbers are for example 23-29-36-42-44-47 then the ranges they define are: 1 to 23,
24 to 29,
30 to 36,
37 to 42,
43 to 44 and
45 to 49.
For example ticket 15-25-31-33-41-49 then has the following distribution pattern: XXX--X. Its first number 15 fits into the first range (1 to 23) so the first part of the pattern is X. Second number 25 also fits into the second range (24 to 29) so the pattern continues with X. Number 31 is in the third range so the pattern has X at the third position. Numbers 31 and 41 do not fit into ranges at appropriate positions so the pattern shows - at fourth and fifth positions. The last number 49 fits into the last range so the last part of the distribution pattern is X.
Note: The first range always starts with the lowest pool number. The last number range always ends with the highest pool number.
The latest five draws in Expert Lotto 6/49 and their distribution patterns are:
2010/28 Sun 2nd, 23-29-36-42-44-47-[07] -----X
2010/28 Sun 1st, 06-13-14-19-41-42-[29] -XX--X
2010/28 Wed 2nd, 02-13-16-17-25-40-[27] X---XX
2010/28 Wed 1st, 16-18-22-23-28-29-[24] ---XX-
2010/27 Sun 2nd, 01-06-12-24-32-41-[44] XX-X-X
When filter settings are Winning Numbers: 5 latest draws then:
See also Winning Numbers Ranges statistics.
This filter opens from menu Package - Reduce - Mutual Match. The filter compares all tickets in the Package with each other. If there are for example 10 tickets in the Package then the first ticket will be compared with tickets 2 to 10, the second ticket will be compared with tickets 3 to 10, the third ticket will be compared with tickets 4 to 10 etc.
Let's assume the Package contains the following tickets:
01-02-03-04-05-06
01-02-03-08-09-10
01-02-03-31-32-33
01-22-23-24-25-16
01-22-23-24-25-26
This filter removes surplus tickets from the Package while maintaining the selected win guarantee. The filter opens from menu Package - Reduce - Optimize Coverage. You can use the filter either to create optimized wheels or to filter the result of your lottery strategy to reduce the cost of your bet.
Wheels with a win guarantee are usually described as "x if y (n)". Where "x" is the lowest guaranteed match when "y" winning numbers are drawn from "n" numbers the wheel is created from. For example wheel "3 if 6 (20)" guarantees at least one match 3 prize when any 6 numbers out of pool's 20 numbers hit in the next draw. The smallest possible wheel with such win guarantee contains ten tickets. It means you must bet at least 10 tickets if you want to win at least one match 3 prize. All six winning numbers must come from the twenty numbers the wheel is combined from.
Use the following steps to create an optimized wheel from 20 numbers with 3 if 6 win guarantee in Expert Lotto 6/49 Demo lottery:
Note that the resulting optimized wheel consists of 14 tickets while the smallest possible wheel for the same win guarantee needs just 10 tickets. The algorithm this filter implements will never produce wheels that match highly optimized and tightly woven wheels you can find on internet. The main purpose of this filter is the coverage optimization of tickets resulting from your lottery strategy, not creation of optimized wheels from scratch.
If you are on a tight budget, you can create even smaller optimized wheels:
In the steps above we lowered the required win guarantee from 100% to 95% and the resulting wheel consists of 8 tickets only. That is reduction by 42%. So while still having very high chance (95%) of winning at least one match 3 prize we managed to lower the wheel size significantly and thus saved a lot of money.
![]() Keep in mind that lowering the required win guarantee by a few percent or just a fraction of percent can decrease the size of optimized wheel by tens or hundreds of tickets.
Keep in mind that lowering the required win guarantee by a few percent or just a fraction of percent can decrease the size of optimized wheel by tens or hundreds of tickets.
If you have just finished applying all the filters according to your lottery strategy and the resulting set of tickets is too large for your betting budget, then there are two options. Either continue filtering with the risk of making an error in your estimates and filtering out the winning tickets. Or use Package Optimizer or Best Tickets filters to reduce the count of tickets and aim for lower tier prizes.
Let's use the following simple (and not very effective) lottery strategy in Expert Lotto 6/49 Demo lottery:
From statistical point of view these tickets have very high chance of winning. However so many tickets are way over any betting budget. So we will use Package Optimizer filter to go after lower tier prizes. The Package contains over half a million tickets that the filter must iterate over many times so we need to increase the filtering speed by optimizing the coverage for selected numbers only.
When the filtering is finished (it will take a while), there will be about 29 tickets left. Those tickets meet all the conditions of our lottery strategy above (odd/even, low/high, sum range) and have 95% chance of winning at least one Match 3 prize if the next winning numbers consist entirely from hot or cold numbers.
To verify the win guarantee, open Package Optimizer filter window again. Select the same set of numbers on the ticket panel (see the picture above) and click button Show Coverage. Then choose Show my winnings when I hit 6 numbers and click button Show.
Package Optimizer filter is capable of reducing the ticket count by several orders of magnitude while maintaining the required win guarantee.
Use the edit fields to define the required win guarantee. For example win guarantee 4 if 5 is expressed as I want to have 100% guarantee of matching at least 4 numbers when I hit any 5 numbers. It means you are guaranteed to win at least one Match 4 prize if the winning numbers include at least 5 numbers of your wheel.
It is possible to significantly reduce the count of filtered tickets (and increase filtering speed) by reducing the probability of winning the required price. For example reducing the chance from 100% to e.g. 98% or 95% still gives very high chance of winning but it will also reduce the size of resulting wheel.
Option Algorithm preference affects filter performance. When smaller resulting wheel is selected, the filter will take more time to finish however the resulting optimized wheel will be smaller and more compact. With option shorter filtering time the filter will perform faster but the resulting wheel will need more tickets to meet the required win guarantee.
The ticket panel on the right of the filter window shows all the numbers in the Package. If a number is not present than its box has gray background and cannot be ticket using mouse.
It is possible to optimize coverage for a smaller set of numbers only. Simply use your mouse to tick/untick numbers on the ticket panel. For example you can tick only numbers that the most/least frequent in several past draws, numbers that did (not) hit for a long time etc. Number coloring highlights numbers selected in statistical tables.
Show Current Coverage button calculates and shows the win coverage of tickets in the Package. Menu Package - Coverage also shows the win coverage of the tickets in the Package. However the coverage is calculated for the whole number pool, i.e. all 49 numbers in a x/49 lottery. The coverage calculator started from Package Optimizer window shows the coverage only for numbers selected on the ticket panel in the filter window. So you can see the win guarantee when you expect that the winning numbers will be drawn from a smaller set of numbers.
![]() The filtering time increases exponentially with the size of the number pool - optimizing the coverage of only 15 numbers will be fast, however optimizing the coverage of the whole 49 number pool will take hours. If possible, untick some numbers on the ticket panel in the filter window.
The filtering time increases exponentially with the size of the number pool - optimizing the coverage of only 15 numbers will be fast, however optimizing the coverage of the whole 49 number pool will take hours. If possible, untick some numbers on the ticket panel in the filter window.
![]() The filter runs much faster on modern multi-core CPUs. Check the number of execution cores your CPU has, then click menu Tools - Options - Miscellaneous - Execution and enter the number of cores into Number of threads for long running tasks field.
The filter runs much faster on modern multi-core CPUs. Check the number of execution cores your CPU has, then click menu Tools - Options - Miscellaneous - Execution and enter the number of cores into Number of threads for long running tasks field.
![]() You can watch the filter progress at the lower right corner of the main window. Click the progress bar to see additional info about the current size of the wheel and the current coverage percentage. You can stop the filter if the coverage is high enough (e.g. 90% or 95%).
You can watch the filter progress at the lower right corner of the main window. Click the progress bar to see additional info about the current size of the wheel and the current coverage percentage. You can stop the filter if the coverage is high enough (e.g. 90% or 95%).
![]() Always check the current coverage before applying this filter. If the win guarantee of the tickets in the Package is e.g. 92% before using this filter then it doesn't make sense to require 100% win guarantee.
Always check the current coverage before applying this filter. If the win guarantee of the tickets in the Package is e.g. 92% before using this filter then it doesn't make sense to require 100% win guarantee.
See also Best Tickets filter.
This filter finds the best or worst tickets in the Package. The filter opens from menu Package - Reduce - Best Tickets.
![]() Use this filter as the last step of your lottery strategy when
the amount of tickets left in the Package is still too large for your betting
budget.
Use this filter as the last step of your lottery strategy when
the amount of tickets left in the Package is still too large for your betting
budget.
See also Package Optimizer filter.
This ticket filter accepts or reject randomly selected tickets in the Package. The filter opens from menu Package - Reduce - Random Selection.
You can use this filter as the last step of your lottery strategy when the amount of tickets left in the Package is too large for your betting budget. You can consider this filter as optimized 'quick pick' as it will select a few tickets at random. But the tickets in the Package already passed all your lottery strategy filters so you should have much larger chance of winning than choosing a totally random quick pick at lottery agent's shop. An alternate filter is Systematic Selection or Best Tickets filter.
This ticket filter accepts or reject every N-th ticket in the Package. The filter opens from menu Package - Reduce - Systematic Selection.
Let's assume the Package contains the following tickets:
01-02-03-04-05-06
01-02-03-04-05-07
01-02-03-04-05-08
01-02-03-04-05-09
01-02-03-04-05-10
01-02-03-04-05-11
01-02-03-04-05-12
01-02-03-04-05-13
01-02-03-04-05-14
01-02-03-04-05-15
Then after filtering with settings Accept every 4th ticket the Package will contains only the following tickets:
01-02-03-04-05-09
01-02-03-04-05-13
Complex Filter groups several simple filters together so that they can be applied in a single step. Complex Filters also allow combining of simple filters together using AND/OR logical operators. Complex Filters can be saved to a file on your disk and reopened on next application startup.
To create a new Complex Filter, click menu File - New - Complex Filter. To open an existing Complex Filter click menu File - Open File and select Filter Files in Files of type combo box at the bottom of file browser window that opens from that menu command.
![]() You can also drag and drop a complex filter file into
the main application window to open that filter. Complex Filter files
have .filter extension.
You can also drag and drop a complex filter file into
the main application window to open that filter. Complex Filter files
have .filter extension.
You can reuse Complex Filters in various lotteries installed on your computer. The following rules apply:
Complex Filter window has four different modes. You can switch between the modes by clicking at appropriate buttons at the top of the Complex Filter window.
In Design mode you construct and customize your complex filter. The Design screen is divided into three parts. At the top there is Name & Description pane where you can enter the name and a short description of your complex filter. The pane is collapsible by clicking on its header. The middle part of the Design screen is the actual filter hierarchy. At the bottom of the screen there is collapsible Preview pane.
![]() You can collapse Name & Description and Preview panes to maximize the screen area available for the filter tree.
You can collapse Name & Description and Preview panes to maximize the screen area available for the filter tree.
 You can change the layout of split windows using menu View - Split orientation.
When creating a new Complex Filter its filter hierarchy is initially empty. To add a new filter to your complex filter, click button Add filter at the top-right corner of Complex Filter window. This opens Select Filter window listing all available filters. Select the filter you wish to add and click Select button. The filter is added to the complex filter hierarchy and its settings are available at the lower part of filter hierarchy area. Repeat the same steps to add another filter to the complex filter.
Another way of adding a filter is using Filters window - simply drag the desired filter from Filters window and drop it into the Complex Filter window. Note that there's a visual hint when dragging a filter over complex filter hierarchy indicating where the filter can be dropped.
If you have other Complex Filters stored on your disk you can drag them from e.g. Windows Explorer window and drop them into Design tab. Dropped filters will be added as references. It is even possible to drag and drop a folder with Complex Filters. Each folder and sub-folder will be added as a group of filter references.
To customize the settings of any filter in the hierarchy, click the filter in the table first. The lower part of the Designer window will then show controls for the modification of the settings of the selected filter. Note that filter's description updates automatically in the Description column as you make changes to filter's settings.
![]() You can drag the divider between filters table and
filter settings area to enlarge the upper or the lower part of the
Designer window as needed.
You can drag the divider between filters table and
filter settings area to enlarge the upper or the lower part of the
Designer window as needed.
If you wish to remove a filter from complex filter hierarchy select the filter using your mouse then press Delete key. You can also use menu Edit - Delete or right-click the filter in the list and select Remove from its popup menu.
Note: Removing a Filter Group (see below) also removes all filters belonging into that group.
The complex filter hierarchy is shown as a table with several columns:
Clicking a table column sorts the table in ascending or descending order which makes it easier to find a particular filter in a deep complex filter hierarchy. Table columns are resizable by dragging their border.
You can reorganize the filters within complex filter hierarchy
using mouse drag and drop. It is also possible to copy selected filter(s) using Ctrl+C keyboard shortcut and paste them as copy to a different place in filter hierarchy using Ctrl+V shortcut.
It is strongly recommended to place the more
expensive filters to the bottom of each filter group to increase the
filtering speed. For example a filter checking the sum of ticket
numbers is very fast and doesn't consume that many computational
resources. However a filter which compares each ticket with other
tickets in a file is very expensive and much more CPU time is
needed for its execution. So if complex filter rejects a ticket because
its sum is outside allowed range then there is no point comparing that
with other tickets from a file and the whole complex filter is executed
much faster.
Right-click any filter or any filter group in the hierarchy to open its popup menu. You can use it to preview, run, back-test, or analyze performance of the selected filter instead of the whole complex filter hierarchy. Select Disable from the popup menu to turn the filter off. Disabled filters, displayed using strike-through font, are not applied when the complex filter is being executed. Select Enable from disabled filter's popup menu to turn that filter on again. This way you can fine-tune your complex filter
![]() You can select multiple items in the filter hierarchy and right-click them to get the following choices in popup menu:
You can select multiple items in the filter hierarchy and right-click them to get the following choices in popup menu:
Note: When the filter is being executed in a Preview pane or Run mode you can still make changes to the complex filter however those changes are not propagated to the already running filter. You must execute the filter again to have the changes reflected in the filtered tickets.
Note: Red color in Filters column denotes filters that failed one or more draws in a back-test.
Filters at the same level of complex filter hierarchy are organized into filter groups. A filter group is basically a filter condition applied to tickets being filtered - filter group accepts a ticket if sub-filters within the group accept the ticket. By default the filter group condition is that all filters within the group must accept the ticket. However it's possible to customize the count of filters required to pass which allows various logical operators to be applied on filters within the group.
For example let's assume that a filter groups has sub-filters called A, B and C:
All of the above can be combined with Matching Tickets: Accept/Reject option for group filters, which is the equivalent of logical operator NOT. Filter groups can contain other filter groups so it's possible to build very rich logical constructs that should fit any filtering needs.
Each complex filter has at least one filter group which is the root of the complex filter hierarchy. To add another filter group click Add group button at the top-right corner of the designer window. To add a filter to a group, first select the group in the table then click Add filter button or simply drag a filter from Filters window and drop it to the filter group row in the table. The dropped filter will be added to the end of filter list within that group. You can also move filters between the groups using mouse drag and drop. Select the filter group in a table to adjust its settings in the lower pane.
Filter preview shows how many tickets the filter accepts and rejects. It should be used frequently when designing a complex filter to ensure that the selected filter settings are correct and that no filter in the hierarchy rejects all filtered tickets.
To preview the complex filter, first expand the Preview pane at the bottom of the designer screen by clicking its header. Then click Select button to open popup menu to choose the tickets the filter will be applied to:
Then click button Preview to execute the filter on the selected tickets. While the filter is running you can see a progress bar in the Preview pane and at the bottom right corner of the main application window where you can abort the filter preview. The count of tickets accepted/rejected so far is available in the Preview pane. Also the filters table shows the count of tickets accepted/rejected by individual filters. Use the ticket counts in Accepted and Rejected columns to identify possible problems in your filter hierarchy - for example filter accepting all or too many tickets or a filter rejecting all tickets.
You can also preview an individual filter in the complex filter hierarchy or an individual filter group with all its sub-filters. To do so, right-click the filter or the filter group in the table and choose Preview from its popup menu. Alternatively make sure the filter/filter group is selected in the table and then click the little down arrow on Preview button. It opens a popup menu where you can choose whether the whole complex filter is to be previewed or just the selected filter/filter group. The name of the filter being previewed is shown at the top of the Preview pane.
Click Run button at the top of Complex Filter window to switch to Run mode where you can apply the complex filter on selected tickets and see a table of tickets the filter accepted. First click Select button to choose the tickets to be filtered. The options are the same as described in Filter Preview section above. Select option Matching Tickets: Accept if you wish to see tickets accepted by the filter or click button Reject if you wish to obtain tickets rejected by the filter. Then click Run button to execute the filter. While the filter is running, you can see a progress bar at the top of Complex Filter window and also at the bottom right corner of the main application window where you can abort the filter execution. The filtered tickets will show in the table in the middle of the Complex Filter window.
![]() Click any filtered ticket in the table to see its
statistical properties in Ticket Properties window and its number
layout in Ticket Panel window.
Click any filtered ticket in the table to see its
statistical properties in Ticket Properties window and its number
layout in Ticket Panel window.
When the filtering is finished you can use toolbar at the bottom of the Complex Filter window to process the filtered tickets:
You can also execute an individual filter in the complex filter hierarchy or an individual filter group with all its sub-filters. To do so, right-click the filter or the filter group in the table and choose Run from its popup menu. Alternatively make sure the filter/filter group is selected in the table, switch to Run mode and then click the little down arrow on Run button. It opens a popup menu where you can choose whether the whole complex filter is to be executed or just the selected filter/filter group. The name of the filter being executed is shown at the top of the Run pane.
![]() Use menu Edit - Find to search for a ticket with given numbers in the list of filtered tickets.
Use menu Edit - Find to search for a ticket with given numbers in the list of filtered tickets.
Back-testing a filter means that the filter condition is
applied on past winning numbers
to check that the filter accepts Jackpot winning tickets. Click
Back-test button at the top of Complex Filter window to switch to
Back-test mode, click Select button to choose past draws for
back-testing and then click Back-test button. While the
filter is running you can see a progress bar at the top of Complex
Filter window and also at the bottom right corner of the main
application
window where you can abort the filter execution. The filtered draws
will show in the table in the middle of the Complex Filter window.
Draws rejected by the filter are displayed in strike-through font. You
can also see the count of draws accepted by the filter and the count of
draws the filter rejected at the top of the Complex Filter window.
The last two columns in the Back-test results table show the name and the description of the filter that rejected the given draw. You can double-click the row with reject draw to switch to Design tab and have the filter node selected. This way you can quickly fine-tune your Complex Filters.
![]() Click any draw in the table to see its
statistical properties in Ticket Properties window and its number
layout in Ticket Panel window.
Click any draw in the table to see its
statistical properties in Ticket Properties window and its number
layout in Ticket Panel window.
When the filtering is finished you can use toolbar at the bottom of the Complex Filter window:
You can also back-test an individual filter in the complex filter hierarchy or an individual filter group with all its sub-filters. To do so, right-click the filter or the filter group in the table and choose Back-test from its popup menu. Alternatively make sure the filter/filter group is selected in the table, switch to Back-test mode and then click the little down arrow on Back-test button. It opens a popup menu where you can choose whether the whole complex filter is to be back-tested or just the selected filter/filter group. The name of the filter being back-tested is shown at the top of the Back-test pane.
Note: Even when a filter rejects all past draws then it doesn't necessarily mean that it's a bad filter. The filter may not yield Jackpot winning numbers but it can still be profitable by generating a lot of lower-division prizes.
Note: When a filter is being back-tested you cannot make any changes to the complex filter hierarchy. When the filter is finished then the editing of filter settings is enabled again.
![]() Use menu Edit - Find to search for a draw with given numbers.
Use menu Edit - Find to search for a draw with given numbers.
If you play a lottery that draws one or more bonus numbers from the same pool as the main numbers you can tick option Merge bonus to main numbers in Draw Selection window. That option changes the behavior of filters that compare the filtered ticket/draw with past winning numbers draws, it does not affect in any way filters that do not use past winning numbers to accept/reject filtered tickets.
For example in Expert Lotto 6/49 demo lottery the latest winning numbers are 23-29-36-42-44-47 and bonus number 7. The previous winning numbers are 6-13-14-19-41-42 and bonus number 29. If you back-test for example filter Match Winning Numbers with settings Match 2, 1 latest draw you will see that back-test rejects the latest draw 2010/28 Sun 2nd because there's a match in a single number only (42) when compared with the previous draw 2010/28 Sun 1st. However if you press Select button in Back-test tab and tick option Merge bonus to main numbers the latest draw will be accepted. It is because the latest draw 2010/28 Sun 2nd with winning numbers 23-29-36-42-44-47 and bonus number 7 is actually compared with merged draw 2010/28 Sun 1st that has seven main numbers 6-13-14-19-29-41-42. And there is a match in two numbers (29 and 42).
Filter performance shows how many actual winning numbers can be found in the best ranked numbers in filtered tickets:
The
picture below shows the performance results for Match Winning Numbers filter in the demo Expert Lotto 6/49 lottery. This filter accepts only
tickets that match any of the five latest draws in 3 or 2 numbers.
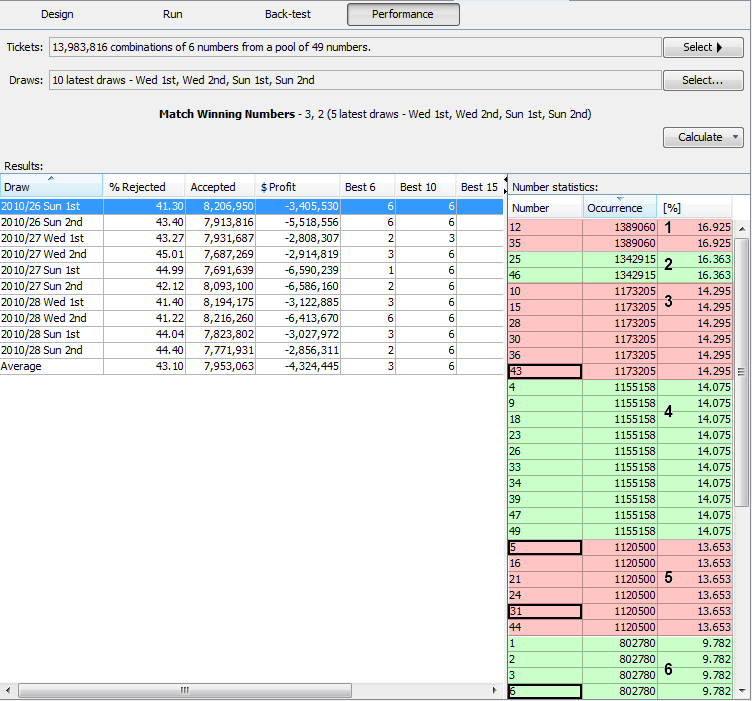
During the performance test the filter was applied to all
13,983,816 tickets in the Package - see the Tickets field. Because 10
latest draws are selected for performance testing - see the Draws field
- the filter was actually executed 10 times - once for each of the
selected draws.
The results table shows the dates of selected past draws. Column Accepted shows how many tickets the filter accepted in the given run. Column % Rejected shows the percentage of rejected tickets in each filter run. A well performing Complex Filter rejects a lot of tickets while still accepting the Jackpot one, or at least the tickets that yield a lot of lower level prizes.
Column Profit gives the total balance as if all tickets accepted by the filter were played for the given draw. Hovering mouse cursor above any cell in this column shows a tooltip with the total cost of such a bet and its total winnings. The values in the example above are based on the following payouts: Jackpot: $2,000,000, 2nd Prize: $100,000, 3rd Prize $1,000, 4th Prize $100, 5th Prize $5 and the cost of a single ticket is $1.
The following columns show the break-down of all winnings. The columns are labeled Jackpot, 2nd Prize, 3rd Prize etc (according to your lottery setup). The columns give the count of winning prizes found in each test run.
The rest of the table columns are labeled e.g. Best 6, Best 10, Best 15 etc - depending on your lottery settings. These columns show how many winning numbers from the given draw fall into the best 6/10/15 number ranks. Click any draw date to see detailed number statistics for the given draw.
The last table column Match Count shows how many pool numbers were left after the given filtering run and how many winning numbers were found in that pool. For example value 5/37 means that tickets accepted in the filtering run consisted of 37 unique numbers and there were 5 winning numbers among those 37 numbers.
The picture above shows number statistics for draw 2010/26 Sun 1st. The filter accepted 8,206,950 tickets in this performance test step and the most frequent numbers are: 12 and 35. So the highest number rank consists of numbers 12 and 35. Numbers 25 and 46 are less frequent creating the second rank. The third rank includes numbers 10,15,28,30,36 and 43. The whole number pool is divided into 6 ranks. The actual winning numbers for the selected draw are highlighted with black border. So winning number 43 falls into the third rank, winning numbers 5 and 31 fall into the fifth rank and the rest of the winning numbers fall into the lowest, sixth rank. Therefore the results table shows that 6 winning numbers fall into the 6 best numbers ranks in column Best 6.
Note: To achieve valid back-test results the winning numbers database automatically excluded draw 2010/26 Sun 1st and all following draws to simulate the state that winning numbers for draw 2010/26 Sun 1st haven't been drawn yet when testing the filter performance for this draw. The same applies when executing the filter for other selected draws.
The second picture shows number statistics for draw 2010/27 Wed 1st: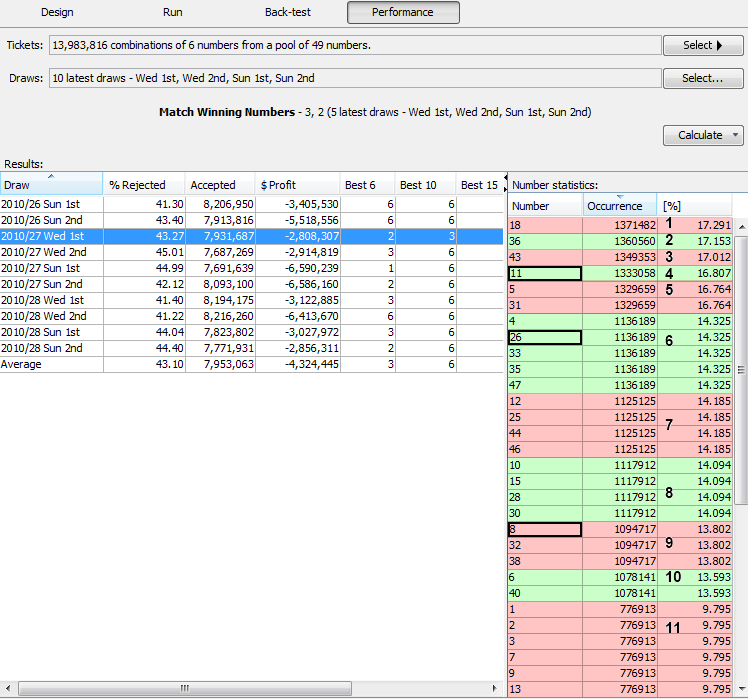
On average this filter yields 3 winning numbers in the best 6 ranks and even all 6 numbers in the best 10/15 ranks - see the last Average row in the results table. It may seem as a very good result, however this filter generates only a few ranks for the whole number pool so naturally there's a bigger chance the winning numbers will fall into higher ranks. But if you manage to design a complex filter that on average yields e.g. four or more winning numbers in the first 15 ranks and there are not too many numbers in each rank then it might be a good idea to filter a full package with such a filter and then setup a wheel of the 15 most frequent numbers from the filtered package.
You can also calculate the performance of an individual filter in the complex filter hierarchy or an individual filter group with all its sub-filters. To do so, right-click the filter or the filter group in the table and choose Performance from its popup menu. Alternatively make sure the filter/filter group is selected in the table, switch to Performance mode and then click the little down arrow on Calculate button. It opens a popup menu where you can choose whether the whole complex filter is to be tested for performance or just the selected filter/filter group. The name of the filter being evaluated is shown at the top of the Performance pane.
Note: When a filter is being executed in Performance mode you cannot make any changes to the complex filter hierarchy. When the filter is finished then the editing of filter settings is enabled again.
This filter does exactly the same job as Analyzer Table Filter. The only differences is that you can add Occurrences filters into a complex filter to group them together.
There is an optional plugin called Automation which among other features adds a possibility to analyze selected statitistics and automatically build complex filters consisting of Occurrences filters that match desired occurrence settings in analyzed statistics.
To install the Automation plugin click menu Tools - Plugins, switch to Available Plugins tab and tick Automation plugin listed there and click Install button. When the plugin installation is finished use menu Tools - Automation - Build Filters - Occurrence.
This is a very powerful filter which accepts tickets that have selected statistical properties. Using this filter you can automate some mundane and repeating filtering tasks, e.g. as described here. Several Statistical Filters combined in a Complex Filter can provide a reliable filtering tool to obtain a starting set of tickets as an input for your lottery strategy.
The filter is based on statistical tables in Analyzer window. The filter first calculates the statistics of selected past draws and then accepts only tickets that have desired values in selected column(s) in statistical table.
Note: All examples below are given for Expert Lotto 6/49 Demo Lottery.
To use the filter, first click button Select to choose past
winning numbers draws to calculate draw interval statistics from. In
Analyze combo box select which statistical property the filter
will evaluate. Then select desired statistical table column(s) in the
table below and the required value or value range the accepted tickets must
have. Click Add button to insert additional condition, click Remove button to drop the last condition in the list.
Option Match all of the following makes the filter accept only tickets
that meet all the conditions listed in the table. Option Match any of
the following makes the filter accept tickets that meet at least one of
the listed conditions.
Some statistical properties selected in Analyze combo box add another
filtering option: Applies to X to Y in each ticket. That is because
when filtering e.g. according to statistics of ticket numbers then each
accepted ticket can contain up to 6 numbers that the filter's
statistical condition(s) pull from the whole number pool (in a 6/xx
lottery).
The conditions in Statistical Filter look like this:
StatisticalTableColumnName Operator NumericalValue
Where the StatisticalTableColumnName is one of
See also here.
| Operator | Example | Meaning |
= |
Ticket Numbers: Occurrence = 5 | Select pool numbers that appear exactly 5 times in the selected past draws. |
> |
Triplets: Latest > 4 | Select triplets that haven't hit for more than 4 draws in the selected past draws. |
>= |
Pairs: Occurrence >= 3 | Select pairs that appear 3 or more times in the selected past draws. |
< |
Ticket Numbers: Latest < 3 | Select pool numbers that hit in the very latest draw or in previous draw in the selected past draws. |
<= |
Pairs: Due <= 0.8 | Select pairs that are not likely to hit again in the next draw. |
Highest |
Ticket Numbers: Latest Highest 5 | Select 5 ranks of pool numbers that haven't hit for the longest time in the selected past draws. |
Lowest |
Ticket Numbers: Due Lowest 10 | Select 10 ranks of pool numbers that are least likely to hit in the next draw. |
Note: Operators Highest and Lowest select the best and the worst ranking property values. A rank consists of statistical property values that have the same value in given statistical table column. For example when analyzing 10 latest draws in Expert Lotto 6/49 Demo Lottery then the Latest column in Ticket Numbers table sorted in descending order looks like this:
| Main Number | Latest |
| 5 | 10 |
| 31 | 10 |
| 43 | 10 |
| 38 | 9 |
| 11 | 8 |
| 8 | 8 |
| 26 | 8 |
| 48 | 8 |
| 49 | 8 |
| 20 | 7 |
| 33 | 7 |
| 35 | 7 |
| 30 | 6 |
| 15 | 6 |
| 37 | 6 |
| 32 | 5 |
| 1 | 5 |
| 12 | 5 |
| 24 | 5 |
| more... | more... |
The highest ranking numbers are the ones with Latest value of
10 (5,
31, 43), the second best rank is number 39 with Latest value of 9, the
third best rank are numbers with Latest value of 8 (11, 8, 26, 48, 49)
etc. So filter condition Ticket Numbers: Latest Highest 3 will select
pool numbers with Latest values 10, 9 and 8, the numbers are 5, 31, 43,
38, 11, 8, 26, 48, 49. Filter condition Ticket Numbers: Latest Highest
1 will select pool numbers 5, 31, 43 - not just the the first row of
statistical table sorted in descending order.
Operator Lowest works the same way except that it looks at the lowest
ranking of numbers, i.e. at the bottom of the table above.
With filter settings on the screen shot below the filter
accepts tickets, which contain 1 or 2 numbers that hit most frequently
in the last ten draws AND are long overdue.
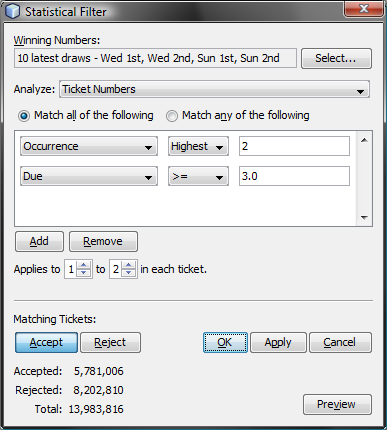
With filter settings on the screen shot below the filter
accepts
tickets, which contain at least one triplet that has never been drawn
yet in the whole lottery history.
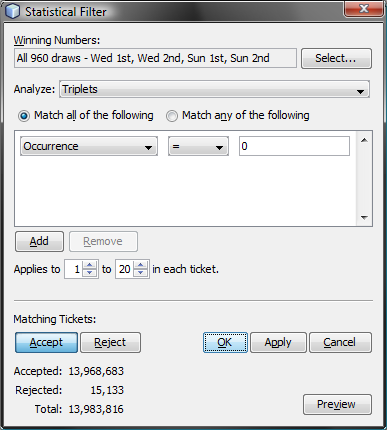
With filter settings on the screen shot below the filter
accepts
tickets, which contain at least one number that hasn't hit for 20 or
more draws OR at least one number which is long overdue.
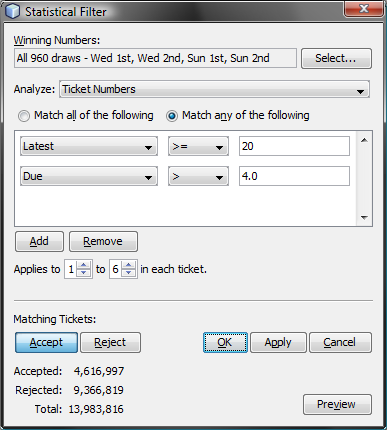
The main advantages of Statistical Filter are:
Trend Predictor filter is based on automated pattern matching predictions. The filter first predicts the trend (increase/decrease/level) of selected statistical properties. Then it calculates the statistics of filtered tickets and compares them with the statistics of the latest selected draw. The filter accepts a ticket if its statistical properties match the predicted trend.
There are two tabs in the filter window. Properties tab lists all available statistical properties the filter can predict. Tick the properties you wish to include in your filter condition. You can even select multiple properties and then tick/untick them with a single click. Prediction Settings tab contains controls to adjust prediction preferences, read more here.
The latest draw in Expert Lotto 6/49 Demo lottery is:
2010/28, Sun 2nd, 23-29-36-42-44-47-[07]
Its ratio of odd numbers to even numbers is 3:3 and the ratio of low numbers to high numbers is 1:5. Click menu Winning Numbers - Predictions to predict the next values of these statistical properties. In Predictions window choose 50 latest draws for prediction input, adjust prediction options as on the picture below and press Finish button.
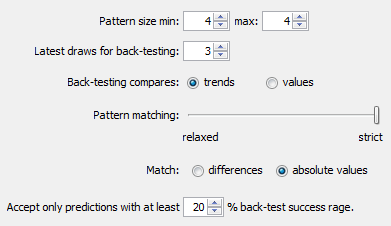
When prediction process is finished, you will see in Winning Numbers Properties window that the predicted trend of Odd/Even statistics is decrease. That means the next draw is expected to produce either 2:4 or 1:5 or 0:6 ratios of odd/even numbers. The prediction for Low/High statistics shows level trend, so the same 1:5 ratio of low/high numbers should be expected in the next draw.
Now we will use Trend Predictor filter to find tickets that match the predicted trends:
All the tickets left in the Package match the predicted trends. Their ratio of low/high numbers is 1:5 and their ratio of odd/even numbers is either 0:6 or 1:5 or 2:4 or 3:3.
If you choose At least 1 to 2 predictions must match then there will be 9 503 516 tickets left after filtering. Their ratio of low/high numbers is 1:5 or their ratio of odd/even numbers is either 0:6 or 1:5 or 2:4 or 3:3.
Note: Even when the predicted trend is increase, the filter also accepts tickets that produce the same statistical value, not just tickets with higher statistical values. Likewise, when the predicted trend is decrease, the filter also accepts tickets that produce the same statistical value, not just tickets with lower statistical values. This is to relax the filtering conditions a bit and to err on the safe side.
You can combine as many statistical properties in the Trend Predictor filter as you want. However keep in mind that some trend predictions may be either contradictory or impossible to match and the filter may reject all tickets. For example if the latest winning numbers are 1-2-3-4-5-6 and trend prediction for the first ticket number is decrease then naturally no ticket can match this condition. There is no pool number lower than 1.
When the latest winning numbers are for example 10-11-12-13-14-15 and the predicted trend for the first ticket number is increase and the trend of the second number is decrease then the predictions are contradictory. Ticket numbers are sorted in ascending order so it is not possible to have the first ticket number greater than 10 and the second number lower than 11.
Note: If it is not possible to make valid prediction for a given statistical property then all filtered tickets are considered as matching the trend prediction of that property.
The filter accepts tickets that have the same numbers at selected ticket positions as selected past draws.
The latest five draws in Expert Lotto 6/49 Demo Lottery are:
2010/27, Sun 2nd, 01-06-12-24-32-41-[44]
2010/28, Wed 1st, 16-18-22-23-28-29-[24]
2010/28, Wed 2nd, 02-13-16-17-25-40-[27]
2010/28, Sun 1st, 06-13-14-19-41-42-[29]
2010/28, Sun 2nd, 23-29-36-42-44-47-[07]
Filtering with settings Winning Numbers: 5 latest draws, Matching positions must come from the same draw, Position 1, 2, 3, 4, 5, 6, At least 6 to 6 positions must match accepts exactly five tickets from the full wheel. The accepted tickets have the same numbers as the five latest draws.
Filtering with settings Winning Numbers: 5 latest draws, Position 1, 2, 3, 4, 5, 6, At least 6 to 6 positions must match accepts 1,157 tickets. Each accepted ticket has only the following numbers at the first ticket position: 1, 2, 6, 16 or 23. Numbers allowed at the second ticket position are 6, 13, 18 or 29. The third ticket position can have numbers 12, 14, 16, 22 or 36, fourth position allows numbers 17, 19, 23, 24 or 44, numbers at the fifth position are 25, 28, 32, 41 or 44 and the last ticket position has numbers 29, 40, 41, 42 or 47.
Filtering with settings Winning Numbers: 5 latest draws, Matching positions must come from the same draw, Position 1, 2, At least 2 to 2 positions must match accepts tickets that have in the first ticket position numbers 1, 2, 6, 16, 23 and in the second ticket position numbers 6, 13, 18 or 29.
See also Match Winning Numbers filter.
This filter accepts tickets that have odd or even numbers at specified ticket positions.
To use the filter, first tick the ticket position you want to filter and then choose whether a ticket number at selected position must be odd or even. Option At least X to Y positions must pass specifies how many positional conditions must be met to accept a given ticket.
Note: Number zero is considered to be an even number.
Filtering with settings Position 1: Odd, Position 2: Odd, Position 3: Odd, At least 1 to 2 positions must pass accepts tickets like 1-4-5-10-20-30 because the first and the third ticket numbers are odd so only two of the filter conditions are met as required. Filter rejects tickets like 1-3-5-10-20-30 because all the first three numbers are odd so too many filter conditions are met.
See also Odd/Even ticket filter and Odd/Even statistical properties.
This filter accepts tickets that have low or high numbers at specified ticket positions. Number is low when it is in the lower half of number pool, number is high when it is in the upper half of number pool.
For example in a x/40 lottery, numbers 1 to 20 are low, numbers 21 to 40 are high numbers. In a x/49 lottery, numbers 1 to 24 are low, numbers 25 to 49 are high.
To use the filter, first tick the ticket position you want to filter and then choose whether a ticket number at selected position must be low or high. Option At least X to Y positions must pass specifies how many positional conditions must be met to accept a given ticket.
Filtering with settings Position 1: Low, Position 6: High, At least 1 to 2 positions must pass accepts tickets like 1-30-35-40-45-49 because the first and the last ticket numbers are low and high respectively. Filter also accepts ticket e.g. 1-2-3-4-5-6 because the first number is low and the last number is also low, so at least one filter condition is met as required.
There is no ticket to pass filter settings Position 1: High, Position 6: Low, At least 2 to 2 positions must pass. Because ticket numbers are sorted in ascending order in the Expert Lotto 6/49 demo lottery so there can never be a ticket with the first number higher than the last ticket number.
See also Low/High ticket filter, Low/High statistical properties.
This filter accepts tickets with selected numbers at selected ticket positions.
To use the filter, first tick the ticket position(s) you wish to filter. Then enter the desired numbers into appropriate edit field(s). The numbers must be separated by comma (,) character. The order of number in the edit fields is not significant. Alternatively, you can click Select button to open Select Numbers window and choose the desired numbers on the ticket panel using your mouse.
Filtering with settings Position 1: 1,2,3, Position 6: 49,48,47, At least 2 to 2 positions must pass accepts tickets like 3-20-30-40-42-49 because its first and last numbers are the ones selected in filter's condition. Ticket e.g. 1-20-21-30-35-40 is rejected because number 40 is not allowed to be in the last ticket position.
See also Ticket Positions statistics.
This filter accepts tickets with selected powerball numbers at selected ticket positions.
Note: The filter is available only for lotteries that draw two or more bonus numbers from a separate pool of numbers.
To use the filter, first tick the powerball position(s) you wish to filter. Then enter the desired numbers into appropriate edit field(s). The numbers must be separated by comma (,) character. The order of number in the edit fields is not significant. Alternatively, you can click Select button to open Select Numbers window and choose the desired numbers on the ticket panel using your mouse.
See also Positional Bonus Numbers statistics and Numbers at Positions ticket filter.
This filter accepts only tickets that contain numbers within given range at specified ticket positions.
See also Ticket Numbers statistics.
This filter compares ticket numbers at selected positions with past winning numbers draws. Number movement is the difference between ticket's number and past winning number at the same position. For example if ticket's first number is 4 and latest winning number at the first position is 23 then the number movement is 4-23=-19. If ticket number at position 2 is e.g. 33 and the latest winning number at position 2 is 29 then the number movement at position 2 for the latest draw is 33-29=4.
To use the filter, first click Select button to choose the past winning numbers draws to filtered tickets will be compared with. Then tick the ticket position(s) you wish to filter and enter allowed number movement range for each selected position.
Option All draws must pass says that filter accepts a ticket only if the number movement is within desired range for all selected past draws. With option At least one draw must pass the filter accepts a ticket if the number movement is within the range when compared with at least one of the selected past draws. Note: If only a single past draw is selected in the filter window then those two options produce equal filtering results.
Optional settings Sum of number movement min/max make the filter condition more strict by limiting the sum of number movement values in selected ticket positions.
Draw selection Latest Range 2 to 3 selects the following two draws:
2010/28 Wed 2nd, 2-13-16-17-25-40-[27]
2010/28 Sun 1st, 6-13-14-19-41-42-[29]
See also Number Movement statistics.
This filter accepts only tickets that contain specified first/last digits at specified ticket positions. Each pool number breaks down into two digits. The first digit is the leading digit of the number, the last digit is the second digit of the number. For the first digit of number 23 is 2, the last digit of that number is 3. The first digit of number 9 is 0, the last digit of that number is 9.
See also First/Last Digits ticket filter, First/Last Digits statistics.
This filter compares first/last digits at selected positions with past winning numbers draws. A digit can either move up - it is greater than the digit at the same ticket position of a past draw, or it can move down - it is lower than the digit at the same ticket position of a past draw, or it can be the same as in the past draw it is being compared with.
To use the filter, first click Select button to choose the past winning numbers draws to filtered tickets will be compared with. Then tick the ticket position(s) you wish to filter and choose the desired digit movement for each selected position.
Option All draws must pass says that filter accepts a ticket only if the digit movement is matching all selected past draws. With option At least one draw must pass the filter accepts a ticket if the digit movement is matching at least one of the selected past draws. Note: If only a single past draw is selected in the filter window then those two options produce equal filtering results.
Draw selection Latest Range 2 to 3 selects the following two draws:
2010/28 Wed 2nd, 2-13-16-17-25-40-[27]
2010/28 Sun 1st, 6-13-14-19-41-42-[29]
See also Digits Movement Patterns statistics.
This filter is similar to Sum Range filter. The filter accepts tickets that have the sum of their main numbers at selected ticket positions in desired range.
When filtering with settings Ticket positions: 3, 4, Min sum: 10, Max sum: 20 then:
When filtering with settings Ticket positions: 1, Min sum: 10, Max sum: 20 then the filter will accept tickets that have their first number in the range of 10 to 20.
See also Sum Range filter.
This filter accepts tickets that have the average distance of neighboring numbers in selected range.
The distance is the difference of numbers at neighboring ticket positions. For example in ticket 23-29-36-42-44-47 the distance of numbers 29 and 23 is 6. The distance of the third number from the second number is 36-29=7. So the distance values are 6, 7, 6, 2, 3, the average distance value is then 4.8.
When filter settings are Average distance min: 4 max: 5 then
When filter settings are Average distance min: 5.6 max: 5.6 then
See also Average Distance statistical property.
Accepts tickets that produce given sum ranges when adding numbers at the same ticket positions with selected past draw.
The 11 latest draws in Expert Lotto 6/49 Demo Lottery are:
| 2010/28 Sun 2nd | 23 | 29 | 36 | 42 | 44 | 47 | [07] |
| 2010/28 Sun 1st | 06 | 13 | 14 | 19 | 41 | 42 | [29] |
| 2010/28 Wed 2nd | 02 | 13 | 16 | 17 | 25 | 40 | [27] |
| 2010/28 Wed 1st | 16 | 18 | 22 | 23 | 28 | 29 | [24] |
| 2010/27 Sun 2nd | 01 | 06 | 12 | 24 | 32 | 41 | [44] |
| 2010/27 Sun 1st | 02 | 15 | 22 | 29 | 30 | 37 | [42] |
| 2010/27 Wed 2nd | 20 | 23 | 25 | 30 | 33 | 35 | [07] |
| 2010/27 Wed 1st | 08 | 11 | 19 | 26 | 48 | 49 | [18] |
| 2010/26 Sun 2nd | 08 | 11 | 18 | 32 | 36 | 38 | [06] |
| 2010/26 Sun 1st | 05 | 06 | 11 | 31 | 40 | 43 | [32] |
| 2010/26 Wed 2nd | 8 | 11 | 18 | 32 | 36 | 38 | [6] |
Filtering with settings Winning Numbers: All draws, Draw distance: 2, Position 1: Sum range min: 10 max: 15, All 1 to 1 positions must pass will compare the filtered tickets with draw 2010/28 Wed 2nd as the draw distance is set to 2 and it will accept tickets where the sum of numbers at the first ticket position is in the range of 10 to 15.
For example ticket with numbers 4-5-6-7-8-9 will be accepted because its first number is 4 and the first number of draw 2010/28 Wed 2nd is 6 so 4+6=10 which is in the selected range.
Filtering with settings Winning Numbers: All draws, Draw distance: 10, Position 1: Sum range min: 10 max: 15, Position 6: Sum range min: 30 max 35, All 2 to 2 positions must pass will compare the filtered tickets with draw 2010/26 Wed 2nd as the draw distance is set to 10 and it will accept tickets where the sum of numbers at the first ticket position is in the range of 10 to 15 and the sum of numbers at the last ticket position is 40 to 45.
Only a single ticket will be accepted: 2-3-4-5-6-7 will be accepted because its first number is 2 and the first number of draw 2010/26 Wed 2nd is 8 so 2+8=10 which is in the selected range and their last numbers are 7 and 38 respectively which means their sum is 45 which is again in the desired range..
See also Vertical Pairs Sum statistics.
This filter selects tickets with numbers that fall into ranges formed by previous draws.
The latest two draws in Expert Lotto 6/49 Demo Lottery are:
2010/28, Sun 1st, 06-13-14-19-41-42-[29]
2010/28, Sun 2nd, 23-29-36-42-44-47-[07]
The ranges created by the latest draw 2010/28, Sun 2nd are:
| Position | Min | Max |
| 1 | 1 | 23 |
| 2 | 24 | 29 |
| 3 | 30 | 36 |
| 4 | 37 | 42 |
| 5 | 43 | 44 |
| 6 | 45 | 49 |
Ranges for previous draw 2010/28, Sun 1st are:
| Position | Min | Max |
| 1 | 1 | 6 |
| 2 | 7 | 13 |
| 3 | 14 | 14 |
| 4 | 15 | 19 |
| 5 | 20 | 41 |
| 6 | 42 | 49 |
Note that the lower range for position 1 is always the lowest pool number (usually 1) and the upper range in the last position is the highest pool number (e.g. 49 in a x/49 lottery).
When filtering with settings Latest 2 draws, Any draw must pass, Position 1 to 6: Min 1, Max 1, At least 6 to 6 positions must pass then:
Note: The filter is available only in lotteries where all main numbers come from a single pool, i.e. Jackpot-like lotteries.
This filter accepts tickets that produce History sum differences in given range in selected History Levels.
To use the filter, first click Select button to choose past winning
numbers draws to calculate the History values from. Then tick History
Levels you wish to filter in the table below and enter the desired
minimum and maximum difference for each selected Level. Column Sum
(Prev) shows the History Sum values corresponding to the latest draw
from the selection of past winning numbers. Column Difference (Prev) is
History sum difference corresponding to the latest draw (History sum of
the latest draw minus the History sum value of the second latest draw
from the selection of past winning numbers). Column Range shows the
selected range of History values for given Level.
With option At least X to Y levels must pass you can specify the
minimum and maximum count of selected Levels that must have the History value in the given range to pass the whole filter.
Optional condition The difference in X to Y levels is at most
A to B makes the filter more strict by specifying the minimum and
maximum difference for several History Levels. Note: If the range
specified by values A and B is bigger than the ranges in all selected
Levels then this additional condition has no effect on filtering
results.
See also In Range Differences statistics.
![]() You can tick/untick multiple Levels with a single click -
select table rows you wish to modify using your mouse and then click
into the Level column of one of the selected rows.
You can tick/untick multiple Levels with a single click -
select table rows you wish to modify using your mouse and then click
into the Level column of one of the selected rows.
![]() You can increment or decrement differences in multiple table
cells using your keyboard - select table cells your wish to modify and
then press CTRL+up arrow key to increment values in all selected cell.
Press CTRL+down arrow key to decrement values in all selected cells.
You can increment or decrement differences in multiple table
cells using your keyboard - select table cells your wish to modify and
then press CTRL+up arrow key to increment values in all selected cell.
Press CTRL+down arrow key to decrement values in all selected cells.
![]() You can
paste the differences from system clipboard. For example highlight two
rows or two columns of cells in MS Excel, press CTRL+C to copy the highlighted values into system clipboard, click into the table in filter window and press CTRL+V to paste the values as new filter parameters. Pasting a single row or a single column of cells inserts the values into both Min and Max columns respectively.
You can
paste the differences from system clipboard. For example highlight two
rows or two columns of cells in MS Excel, press CTRL+C to copy the highlighted values into system clipboard, click into the table in filter window and press CTRL+V to paste the values as new filter parameters. Pasting a single row or a single column of cells inserts the values into both Min and Max columns respectively.
Note: When using this filter from My Estimates window, most of the filter settings are already preselected.
This filter accepts tickets with numbers that fall into selected segments in selected History Level.
To use the filter, first click Select button to choose past winning
numbers draws to calculate History values from. Then pick the Level you
wish to filter in Level combo box. Note: You can filter only one
History Level at a time. Next tick the segments you wish to use in the
filter in the table below and enter the minimum and maximum count of
ticket numbers each selected segment must have. Table on the right
shows the current distribution of pool numbers into History segments for selected Level.
Click Customize button to adjust segmentation settings for this filtering session.
Option At least X to Y segments must pass. allows to relax the filter condition by specifying how many selected segments must pass. For example with option At least 2 to 3 segments must pass the filter will also accept tickets whose numbers with into to two selected segments only.
This filter accepts tickets that have selected Segment Combinations at selected History Levels.
To use the filter, first click Select button to choose past winning
numbers draws to calculate History values from. Then tick the Levels you wish to filter in the table below. Next tick the Segment
Combinations that are required to appear in selected Levels.
With option At least X to Y levels must pass you can specify the
minimum and maximum count of selected Levels that must have one of the
selected Segment Combinations to pass the whole filter.
Click button Customize to adjust segmentation settings for the current filtering session.
![]() You can tick/untick multiple Levels or Segment Combinations with
a single mouse
click - first select table rows you wish to modify with your mouse then
click into one of the selected cells.
You can tick/untick multiple Levels or Segment Combinations with
a single mouse
click - first select table rows you wish to modify with your mouse then
click into one of the selected cells.
This filter accepts tickets that produce History differences whose standard deviation is in selected range. Low standard deviation values means that History differences in all Levels are very similar. High standard deviation values mean that History differences differ a lot from each other in all Levels.
When filter settings are Winning Numbers: 10 latest draws, Standard deviation min: 0.0, max 5.0 then:
This filter accepts tickets that have desired count of unique History sum differences. A History value is unique if it doesn't repeat in any other Level.
When filter settings are Winning Numbers: 10 latest draws, The count of unique history differences: 11 to 11 then:
This filter accepts tickets with numbers that have History number differences within given range in selected Levels.
![]() You can tick/untick multiple Levels with a single mouse
click - first select table rows you wish to modify with your mouse then
click into one of the selected cells.
You can tick/untick multiple Levels with a single mouse
click - first select table rows you wish to modify with your mouse then
click into one of the selected cells.
When filter settings are Winning Numbers: 10 latest draws, Levels: 0, 1, 2, Number difference: 5 to 5, Total number count: 2 to 18, Number count in a single level: 0 to 6 then the filter accepts tickets that have at least two numbers with difference of 5 in Levels 0 to 2 in Number History table:
This filter is very similar to the plain History Number Differences filter except that it adds additional condition how many matching numbers must be odd/even.
When filter settings are Winning Numbers: 10 latest draws, Levels: 0, 1, 2, Number difference: 5 to 5, Total number count: 2 to 18, Odd number count: 0 to 18 then the filtering results are the same as when using History Number Differences with settings Winning Numbers: 10 latest draws, Levels: 0, 1, 2, Number difference: 5 to 5, Total number count: 2 to 18, Number count in a single level: 0 to 6.
When filter settings are Winning Numbers: 10 latest draws, Levels: 0, 1, 2, Number difference: 5 to 5, Total number count: 3 to 18, Odd number count: 3 to 3 then the filter accepts tickets that have at least 3 numbers with the History difference of 5 in Levels 0 to 2 in Number History table and exactly three of such numbers are odd:
This filter accepts tickets that have desired count of negative or positive History sum differences in selected Levels.
![]() You can tick/untick multiple Levels with a single mouse
click - first select table rows you wish to modify with your mouse then
click into one of the selected cells.
You can tick/untick multiple Levels with a single mouse
click - first select table rows you wish to modify with your mouse then
click into one of the selected cells.
When filter settings are Winning Numbers: 10 latest draws, Levels: 0, 1, 2, Negative differences count: 3 to 3, Positive differences count 3 to 3 then:
This filter accepts tickets that produce either odd or even History Sum values at selected Levels.
To use the filter first click Select button to choose past winning
numbers draws to calculate History values from. Then tick the Levels you wish to filter in the table below. Next tick either Odd Sum or
Even Sum column or both columns in selected Levels.
With option Odd sum count X to Y you can add another filtering
condition stating that a ticket is accepted only if it produces at
least X to Y odd sums in selected Levels.
![]() You can tick/untick multiple table cell with a single mouse
click - first select table rows you wish to modify with your mouse then
click into one of the selected cells.
You can tick/untick multiple table cell with a single mouse
click - first select table rows you wish to modify with your mouse then
click into one of the selected cells.
This filter accepts tickets with numbers that have selected count of unique History number differences within in each selected Level. History difference of a ticket number is unique if no other number in the filtered ticket has the same History difference value. Optionally it is possible to specify the total count of such unique differences across all selected Levels.
![]() You can tick/untick multiple Levels with a single mouse
click - first select table rows you wish to modify with your mouse then
click into one of the selected cells.
You can tick/untick multiple Levels with a single mouse
click - first select table rows you wish to modify with your mouse then
click into one of the selected cells.
Click menu History - Latest to display the number History values for 10 latest draws. Switch Show as combo box to Differences Only and you will see that History differences in Level 0 are:
| Number | Level 0 | Level 1 | Level 2 | Level 3 | Level 4 | Level 5 | Level 6 | Level 7 | Level 8 | Level 9 | Level 10 |
| 23 | 1 | 3 | 3 | 8 | 2 | 5 | 1 | 2 | 4 | 1 | 8 |
| 29 | 1 | 3 | 2 | 12 | 6 | 17 | 3 | 10 | 2 | 1 | 5 |
| 36 | 1 | 8 | 4 | 18 | 4 | 4 | 3 | 9 | 4 | 16 | 1 |
| 42 | 1 | 1 | 19 | 18 | 13 | 11 | 14 | 2 | 16 | 6 | 5 |
| 44 | 1 | 11 | 14 | 8 | 6 | 3 | 11 | 7 | 27 | 1 | 14 |
| 47 | 1 | 10 | 21 | 12 | 1 | 6 | 9 | 7 | 1 | 1 | 5 |
| 6 | 2 | 3 | 5 | 6 | 11 | 20 | 6 | 12 | 9 | 2 | 17 |
| 13 | 2 | 1 | 19 | 2 | 2 | 22 | 21 | 4 | 2 | 1 | 2 |
| 14 | 2 | 20 | 11 | 22 | 5 | 7 | 14 | 1 | 8 | 5 | 3 |
| 19 | 2 | 6 | 10 | 4 | 1 | 3 | 8 | 5 | 15 | 7 | 7 |
| 41 | 2 | 3 | 14 | 18 | 3 | 18 | 5 | 2 | 2 | 4 | 3 |
| 2 | 3 | 3 | 17 | 8 | 2 | 12 | 2 | 11 | 2 | 13 | 7 |
| 16 | 3 | 1 | 10 | 29 | 7 | 13 | 2 | 5 | 3 | 5 | 3 |
| 17 | 3 | 28 | 2 | 3 | 8 | 7 | 2 | 16 | 11 | 2 | 3 |
| 25 | 3 | 4 | 5 | 2 | 5 | 5 | 1 | 7 | 3 | 3 | 4 |
| 40 | 3 | 7 | 6 | 15 | 5 | 6 | 4 | 15 | 2 | 11 | 2 |
| 18 | 4 | 5 | 2 | 16 | 23 | 5 | 1 | 3 | 3 | 2 | 2 |
| 22 | 4 | 2 | 10 | 11 | 12 | 4 | 6 | 3 | 20 | 7 | 4 |
| 28 | 4 | 9 | 5 | 7 | 16 | 13 | 7 | 4 | 7 | 4 | 4 |
| 1 | 5 | 11 | 4 | 1 | 9 | 6 | 1 | 30 | 3 | 22 | 6 |
| 12 | 5 | 7 | 3 | 2 | 2 | 2 | 7 | 2 | 4 | 10 | 29 |
| 24 | 5 | 9 | 2 | 5 | 13 | 2 | 3 | 19 | 10 | 14 | 9 |
| 32 | 5 | 4 | 9 | 5 | 5 | 8 | 13 | 2 | 4 | 17 | 3 |
| 15 | 6 | 7 | 45 | 10 | 3 | 18 | 5 | 9 | 20 | 8 | 1 |
| 30 | 6 | 1 | 6 | 15 | 2 | 1 | 3 | 3 | 1 | 5 | 1 |
| 37 | 6 | 11 | 15 | 3 | 11 | 5 | 1 | 8 | 3 | 1 | 10 |
| 20 | 7 | 16 | 4 | 2 | 1 | 12 | 4 | 6 | 10 | 1 | 15 |
| 33 | 7 | 4 | 8 | 1 | 1 | 25 | 11 | 28 | 1 | 14 | 6 |
| 35 | 7 | 4 | 3 | 5 | 18 | 5 | 1 | 4 | 2 | 9 | 11 |
| 8 | 8 | 1 | 8 | 8 | 16 | 6 | 8 | 21 | 10 | 12 | 14 |
| 11 | 8 | 1 | 1 | 8 | 11 | 10 | 10 | 10 | 13 | 15 | 6 |
| 26 | 8 | 3 | 29 | 2 | 6 | 13 | 1 | 2 | 6 | 14 | 1 |
| 48 | 8 | 12 | 2 | 1 | 13 | 11 | 2 | 30 | 5 | 2 | 22 |
| 49 | 8 | 7 | 2 | 15 | 13 | 14 | 2 | 7 | 19 | 3 | 7 |
| 38 | 9 | 12 | 12 | 5 | 2 | 30 | 3 | 5 | 5 | 1 | 6 |
| 5 | 10 | 2 | 8 | 7 | 18 | 3 | 5 | 3 | 3 | 21 | 1 |
| 31 | 10 | 2 | 5 | 9 | 7 | 7 | 5 | 5 | 6 | 15 | 17 |
| 43 | 10 | 3 | 16 | 30 | 1 | 18 | 6 | 8 | 3 | 9 | 3 |
| 4 | 11 | 13 | 1 | 6 | 17 | 2 | 17 | 22 | 8 | 6 | 19 |
| 46 | 12 | 2 | 27 | 3 | 5 | 1 | 3 | 3 | 8 | 10 | 10 |
| 10 | 13 | 19 | 5 | 15 | 2 | 3 | 18 | 8 | 18 | 19 | 2 |
| 21 | 14 | 64 | 3 | 23 | 2 | 1 | 2 | 1 | 12 | 6 | 11 |
| 9 | 15 | 14 | 9 | 12 | 3 | 1 | 12 | 5 | 10 | 6 | 2 |
| 34 | 15 | 1 | 8 | 6 | 3 | 15 | 18 | 6 | 3 | 2 | 9 |
| 39 | 15 | 3 | 2 | 23 | 2 | 1 | 5 | 2 | 5 | 10 | 7 |
| 27 | 19 | 1 | 6 | 2 | 4 | 6 | 22 | 2 | 8 | 15 | 14 |
| 3 | 22 | 2 | 2 | 1 | 1 | 1 | 6 | 2 | 3 | 1 | 16 |
| 7 | 25 | 3 | 7 | 22 | 5 | 3 | 4 | 1 | 7 | 2 | 8 |
| 45 | 34 | 1 | 11 | 18 | 1 | 2 | 16 | 33 | 2 | 2 | 5 |
Please note that the table above is sorted in ascending order by column Level 0.
When filter settings are Winning
Numbers: 10 latest draws, Levels: 0, Unique number differences in each Level 6 to 6, Total count of unique number differences 6 to 6, At least 1 to 1 Level must pass then each number in accepted tickets will have a different History difference in Level 0. Such a ticket is for example 01-02-03-04-05-06
Filter rejects for example ticket 01-02-03-04-06-13 because numbers 6 and 13 have the same History difference 2 in Level 0.
When filter settings are Winning Numbers: 10 latest draws, Levels: 0, Unique number differences in each Level 1 to 1, Total count of unique number differences 1 to 1, At least 1 to 1 Level must pass then each number in accepted tickets will have the same History difference in Level 0. Looking at the table above we can see there are only six numbers with the same difference in Level 0: 23-29-36-42-44-47. That means the latest winning numbers.
See also Unique Number Differences statistics.
This filter sums History differences of numbers in filtered tickets and accepts those tickets that have such a sum in given range in selected Levels.
![]() You can tick/untick multiple Levels with a single mouse
click - first select table rows you wish to modify with your mouse then
click into one of the selected cells..
You can tick/untick multiple Levels with a single mouse
click - first select table rows you wish to modify with your mouse then
click into one of the selected cells..
When filter settings are Winning Numbers: 10 latest draws, Levels: 0, 1, 2, Sum of number differences min: 10 max: 30, At least 3 to 3 levels must pass then:
When filter settings are Winning Numbers: 10 latest draws, Levels: 0, 1, 2, 3, 4, 5, 6, 7, 8, 9, 10, Sum of number differences min: 40 max: 50, At least 11 to 11 levels must pass then the filter will find just 4 tickets out of nearly 14 millions that have the sum of History number differences in the range of 40 to 50 in all 11 Levels.
See also Number Differences Sum statistical property.
The filter accepts tickets that have the same History sum value in selected Levels as selected past draw.
The History sums for the latest draw are:
| Level | History Sum |
| 0 | 376 |
| 1 | 744 |
| 2 | 1186 |
| 3 | 1670 |
| 4 | 1999 |
| 5 | 2412 |
| 6 | 2746 |
| 7 | 3158 |
| 8 | 3511 |
| 9 | 3875 |
| 10 | 4245 |
When filter settings are Winning Numbers: 1 latest draw, Levels 0 to 10, Match at least 6 to 11 levels then the filter will accept a single ticket 4-10-26-28-29-46. Its History sums are 376, 744, 1166, 1674, 1996, 2412, 2746, 3158, 3511, 3870, 4253. Six History sums are the same as in the selected latest draws.
See also Sums History filter.
The filter accepts tickets that have the same History difference value in selected Levels as selected past draw.
The History differences for the latest draw are:
| Level | History Sum |
| 0 | +13 |
| 1 | -14 |
| 2 | -27 |
| 3 | +17 |
| 4 | +3 |
| 5 | +8 |
| 6 | +12 |
| 7 | -5 |
| 8 | +23 |
| 9 | +11 |
| 10 | +31 |
When filter settings are Winning Numbers: 1 latest draw, Levels 0 to 10, Match at least 5 to 11 levels then the filter will accept only 5 tickets. One of them is for example ticket 7-13-18-26-31-41 with History differences -2, +32, -27, -20, +3, -19, +12, +32, +23, +11, +16 in Levels 0 to 10. Five History differences are the same as in the selected latest draw.
See also Match Past Sums filter and Sums History filter.
The filter accepts tickets that produce History sums in selected Levels lower or greater than the History sums in selected past draws.
For example the History sums of the latest draw in the demo Expert Lotto 6/49 lottery are 376, 744, 1186, 1670, 1999, 2412, 2746, 3158, 3511, 3875 and 4245 in Levels 0 to 11.
When the filter settings are Winning Numbers: 10 latest draws, Level 0: decrease, Level 1: decrease, Level 2: decrease, Level 3: decrease, Level 4: decrease, Level 5: decrease, Level 6: decrease, Level 7: decrease, Level 8: decrease, Level 9: decrease, Level 10: decrease, At least 11 to 11 levels must pass then the filter will select just 27 tickets from the full wheel. All these tickets will produce History sums lower than 376 in Level 0, lower than 744 in Level 1 etc.
See also History Sum Movement statistics and History Differences Movement filter.
The filter accepts tickets that produce History differences in selected Levels lower or greater than the History differences in selected past draws.
For example the History differences of the latest draw in the demo Expert Lotto 6/49 lottery are +13, -14, -27, +17, +3, +8, +12, -5, +23, +11 and +31 in Levels 0 to 11.
When the filter settings are Winning Numbers: 10 latest draws, Level 0: decrease, Level 1: decrease, Level 2: decrease, Level 3: decrease, Level 4: decrease, Level 5: decrease, Level 6: decrease, Level 7: decrease, Level 8: decrease, Level 9: decrease, Level 10: decrease, At least 11 to 11 levels must pass then the filter will select 475 tickets from the full wheel. All these tickets will produce History differences lower than 13 in Level 0, lower than -14 in Level 1 etc.
See also History Differences Movement statistics and History Sums Movement filter.
The main purpose of ticket analysis is to find recurring patterns in past draws providing hints for the prediction of numbers for the next draw. There are many statistical properties that can be analyzed and evaluated - for example the ratio of odd and even numbers, how many numbers repeat from previous draw(s), or the occurrence of selected triplets and pairs of numbers etc. The results of statistical analysis are commonly used as input parameters for ticket filtering to reduce the list of all possible number combinations down to a reasonable count of tickets.
Analyzed statistical properties are available in various tables and charts. There are tables showing statistical properties of a single ticket or a single past draw. There are also summary tables and summary charts showing how many tickets/draws have a given statistical property.
To analyze tickets in the Package click menu Package - Analyze, to
analyze past draws click menu Winning Numbers - Analyze to open Tickets
Analyzer wizard window where you can select which statistical
properties are to be evaluated. Per-ticket statistical properties of
Package tickets are available from menu Package - Show As - Properties.
Per-draw statistical properties of past winning numbers are available
from menu Winning Numbers - Show As - Properties and from menu Winning
Numbers - Show As - Charts.
Analyzer window shows summary statistics of past winning numbers or summary statistics of tickets in the Package. Analyzer window opens from Tickets Analyzer wizard which is available from menu File - New - Analyzer.
Toolbar at the top of the analyzer window provides the following options:
 - reopens Ticket
Analyzer wizard where you can choose a different selection of tickets or draws
to be analyzed or select different statistics to be calculated.
- reopens Ticket
Analyzer wizard where you can choose a different selection of tickets or draws
to be analyzed or select different statistics to be calculated. - shows the
currently
selected statistics as a table, see below.
- shows the
currently
selected statistics as a table, see below. - shows the
currently
selected statistics as a chart, see below.
- shows the
currently
selected statistics as a chart, see below.![]() Hover mouse cursor above Analyzer window title bar to
see a
tooltip showing which tickets have been analyzed, for example a
selection of past winning numbers draws or tickets in the Package.
Hover mouse cursor above Analyzer window title bar to
see a
tooltip showing which tickets have been analyzed, for example a
selection of past winning numbers draws or tickets in the Package.
Most statistical tables in the Analyzer window have the following columns:
Odd / Even |
Occurrence |
[%] |
0:6 |
134,596 |
0.96 |
1:5 |
1,062,600 |
7.60 |
2:4 |
3,187,800 |
22.80 |
3:3 |
4,655,200 |
33.29 |
4:2 |
3,491,400 |
24.97 |
5:1 |
1,275,120 |
9.12 |
6:0 |
177,100 |
1.27 |
The table above shows the ratio of odd/even ticket numbers calculated for all possible combinations in a 6/49 lottery. From the table you can see that the most frequent combination is 3 odd numbers and 3 even numbers. There are 4,655,200 such tickets which makes 33.29% of all possible number combinations. The least frequent combination is 0 : 6, there are only 134,596 such tickets, that means 0.96% of all possible numbers combinations. So from strictly statistical point of view number, combinations with odd/even ratio 3:3 should be preferred while number combinations with odd/even 0:6 should be avoided when preparing your bet for the next draw.
![]() Click any table column header to sort the table in
ascending
or descending order. Drag column header borders to resize table
columns. Drag column headers to change the order of columns in the
table.
Click any table column header to sort the table in
ascending
or descending order. Drag column header borders to resize table
columns. Drag column headers to change the order of columns in the
table.
![]() You can change the count of decimal places used for
values in
statistical tables using menu Tools - Options - Statistics - Decimal
places.
You can change the count of decimal places used for
values in
statistical tables using menu Tools - Options - Statistics - Decimal
places.
When estimating which statistical property will hit in the next draw it's useful to know how many draws elapsed since the last hit of that property in the selected section of winning numbers database.
The table below shows the odd/even ratio for the latest 30 draws in Expert Lotto 6/49 demo lottery:
| Date | Numbers | Odd/Even |
| 2010/28 Sun 2nd | 23,29,36,42,44,47 [7] | 3:3 |
| 2010/28 Sun 1st | 6,13,14,19,41,42 [29] | 3:3 |
| 2010/28 Wed 2nd | 2,13,16,17,25,40 [27] | 3:3 |
| 2010/28 Wed 1st | 16,18,22,23,28,29 [24] | 2:4 |
| 2010/27 Sun 2nd | 1,6,12,24,32,41 [44] | 2:4 |
| 2010/27 Sun 1st | 2,15,22,29,30,37 [42] | 3:3 |
| 2010/27 Wed 2nd | 20,23,25,30,33,35 [7] | 4:2 |
| 2010/27 Wed 1st | 8,11,19,26,48,49 [18] | 3:3 |
| 2010/26 Sun 2nd | 8,11,18,32,36,38 [6] | 1:5 |
| 2010/26 Sun 1st | 5,6,11,31,40,43 [32] | 4:2 |
| 2010/26 Wed 2nd | 4,18,26,33,35,47 [11] | 3:3 |
| 2010/26 Wed 1st | 5,12,25,31,44,46 [33] | 3:3 |
| 2010/25 Sun 2nd | 10,15,28,30,36,43 [35] | 2:4 |
| 2010/25 Sun 1st | 16,21,24,25,35,46 [47] | 3:3 |
| 2010/25 Wed 2nd | 9,12,23,34,39,49 [24] | 4:2 |
| 2010/25 Wed 1st | 1,6,22,24,34,40 [33] | 1:5 |
| 2010/24 Sun 2nd | 8,12,23,31,37,49 [27] | 4:2 |
| 2010/24 Sun 1st | 11,19,28,29,32,39 [30] | 4:2 |
| 2010/24 Wed 2nd | 12,25,27,33,35,41 [20] | 5:1 |
| 2010/24 Wed 1st | 1,5,27,33,39,48 [36] | 5:1 |
| 2010/23 Sun 2nd | 1,12,24,33,38,42 [11] | 2:4 |
| 2010/23 Sun 1st | 3,13,14,19,23,48 [15] | 4:2 |
| 2010/23 Wed 2nd | 2,19,20,23,32,48 [24] | 2:4 |
| 2010/23 Wed 1st | 3,4,13,25,29,34 [37] | 4:2 |
| 2010/22 Sun 2nd | 4,7,8,23,25,28 [31] | 3:3 |
| 2010/22 Sun 1st | 3,13,19,27,31,44 [2] | 5:1 |
| 2010/22 Wed 2nd | 3,5,6,18,20,22 [48] | 2:4 |
| 2010/22 Wed 1st | 3,7,12,27,30,32 [1] | 3:3 |
| 2010/21 Sun 2nd | 3,9,11,20,23,43 [18] | 5:1 |
| 2010/21 Sun 1st | 1,12,20,23,30,34 [33] | 2:4 |
Blue background highlights all draws with odd/even ratio 4:2. You can see that this combination of odd/even numbers hasn't hit in the last 7 draws as its latest hit is from draw 2010/27 Wed 2nd. The longest interval between two following hits of 4:2 is 5 draws, it happened between dates 2010/25 Wed 2nd and 2010/26 Sun 1st. The shortest draw interval between two hits is one draw, dates 2010/24 Sun 1st and 2010/24 Sun 2nd. The average count of draws between two following hits of odd/even combination 4:2 is 2.83.
Statistical table in Analyzer window shows the information above in this form:
| Odd/Even | Occurrence | [%] | Latest | AVG Interval | Min Interval | Max Interval | Due |
0:6 |
134,596 |
0.96 |
n/a |
n/a |
n/a |
n/a |
n/a |
1:5 |
1,062,600 |
7.60 |
9 |
7.00 |
7 |
7 |
1.29 |
2:4 |
3,187,800 |
22.80 |
4 |
4.33 |
1 |
8 |
0.92 |
3:3 |
4,655,200 |
33.29 |
1 |
3.00 |
1 |
11 |
0.33 |
4:2 |
3,491,400 |
24.97 |
7 |
2.83 |
1 |
5 |
2.47 |
5:1 |
1,275,120 |
9.12 |
19 |
3.33 |
1 |
6 |
5.70 |
6:0 |
177,100 |
1.27 |
n/a |
n/a |
n/a |
n/a |
n/a |
Note: The number of draws elapsed since the latest hit of a statistical property is excluded from the calculation of AVG, Min and Max Intervals since it isn't considered as an actual hit.
Note: Value n/a in statistical tables means that are not enough occurrences of the given statistical property in analyzed past draws to provide draw interval data.
Toolbar above statistical tables provides the following options: - hides
table rows where the Occurrence column shows value 0. It's
useful especially for tables showing many rows, for example when
analyzing triplets or quads.
- hides
table rows where the Occurrence column shows value 0. It's
useful especially for tables showing many rows, for example when
analyzing triplets or quads. - displays the
complete history of draw intervals for selected table row. See below.
- displays the
complete history of draw intervals for selected table row. See below. - exports draw intervals for all table rows into a text file or MS Excel sheet. - opens
Statistical Properties Filter window to accept/reject Package
tickets that have the selected statistical property or properties.
Note: This button is enabled only when the Package isn't empty. - copies selected table rows to system clipboard.
- exports draw intervals for all table rows into a text file or MS Excel sheet. - opens
Statistical Properties Filter window to accept/reject Package
tickets that have the selected statistical property or properties.
Note: This button is enabled only when the Package isn't empty. - copies selected table rows to system clipboard. - if the current analyzer view shows pool numbers then this button adds selected table rows as a new ticket to the end of the current Package contents. Note: When playing for example 6/xx lottery then this button is enabled only when exactly 6 table rows are selected.
![]() You can select one or more table rows, click menu Edit - Copy and then switch to a complex filter window and press menu Edit - Paste to create a new Occurrences filter.
You can select one or more table rows, click menu Edit - Copy and then switch to a complex filter window and press menu Edit - Paste to create a new Occurrences filter.
![]() Some Analyzer tables are connected to ticket filters. For example you can selected several rows in Ticket Numbers analyzer and then open Match Numbers ticket filter. You will see that the numbers highlighted in Analyzer table are automatically pre-selected in the filter window. So you can easily build a Complex Filter that accepts/rejects number with desired statistical properties (Latest, AVG Interval, Due etc). The following ticket filters support this feature:
Some Analyzer tables are connected to ticket filters. For example you can selected several rows in Ticket Numbers analyzer and then open Match Numbers ticket filter. You will see that the numbers highlighted in Analyzer table are automatically pre-selected in the filter window. So you can easily build a Complex Filter that accepts/rejects number with desired statistical properties (Latest, AVG Interval, Due etc). The following ticket filters support this feature:
To see the complete history of draw intervals for a selected
statistical property, click button at the top of
Analyzer window. The draw interval details tables and chart are
displayed at the bottom of Analyzer window:
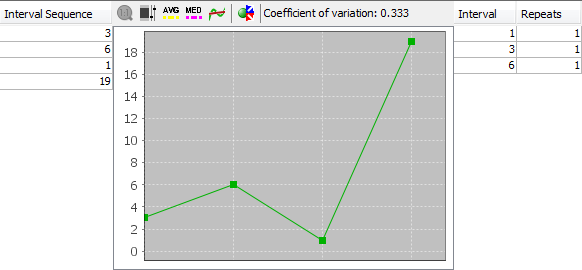
The screenshot above shows draw interval details for odd/even ratio 4:2 for the latest 30 draws in Expert Lotto 6/49 demo lottery. See also the tables above.
Interval Sequence table on the left-hand side shows how many draws elapsed between each hit of 4:2 odd/even ratio. The oldest intervals are at the top of the table, latest values are at the bottom of the table. As you can see from the table odd/even 4:2 hasn't hit for 7 latest draws, 3 draws elapsed between the latest hit and the previous hit of this odd/even ratio. Before that, 4:2 skipped 4 draws etc. Data in this table correspond to statistical properties table above. Interval Sequence table also shows that the minimum interval is 1 and maximum interval is 5 (the number of draws elapsed from the latest hit is excluded from min/max/avg interval calculation).
The same information is also available as a chart in the middle section where you can use various chart tools to estimate the probability that the given statistical property will hit in the next draw.
![]() You can toggle button
You can toggle button ![]() to run automated prediction of the next draw interval. The predicted value is then displayed in chart's toolbar.
to run automated prediction of the next draw interval. The predicted value is then displayed in chart's toolbar.
You can change the layout of split windows using menu View - Split orientation.
Coefficient of variation indicator in chart's toolbar shows the measure of dispersion of data in the chart. Read more details here.
The table on the right shows how many times each draw interval repeats. In the example above interval of 2 draws repeats two times. It is another hint when evaluating the statistics for the next draw: Draw intervals with high repeat counts are likely - from statistical point of view - to repeat again in the coming draws.
![]() You can sort the Interval Repeats table by clicking its
column headers.
You can sort the Interval Repeats table by clicking its
column headers.
Summary statistics are also available as bar charts where it's easier to make a better mental picture how many analyzed tickets have a given statistical property.
Use the toolbar at the top of Analyzer window to customize the chart:
 Zoom - by default each chart shows the whole horizontal axis. You
can zoom any part of the axis by clicking into the chart and dragging
the mouse cursor to the right. To reset the zoom either click this
button or click the chart window and drag the mouse to the left.
Zoom - by default each chart shows the whole horizontal axis. You
can zoom any part of the axis by clicking into the chart and dragging
the mouse cursor to the right. To reset the zoom either click this
button or click the chart window and drag the mouse to the left. Range Tool - toggles adjustable chart ranges. There are two
sliders to the right of chart window highlighting a portion of the
vertical axis when toggled on. Use your mouse to move the sliders, hold
down CTRL key to move both sliders at the same time. Alternatively you
can enter chart ranges directly from keyboard into the spinner fields
at the top and at the bottom of the sliders. The range tool
helps when evaluating how many statistical properties fall into highlighted area.
Range Tool - toggles adjustable chart ranges. There are two
sliders to the right of chart window highlighting a portion of the
vertical axis when toggled on. Use your mouse to move the sliders, hold
down CTRL key to move both sliders at the same time. Alternatively you
can enter chart ranges directly from keyboard into the spinner fields
at the top and at the bottom of the sliders. The range tool
helps when evaluating how many statistical properties fall into highlighted area. Average Value - displays a horizontal line in the chart which denotes
the average occurrence of the given statistical property in analyzed
tickets.
Average Value - displays a horizontal line in the chart which denotes
the average occurrence of the given statistical property in analyzed
tickets. Additional axis - when a chart window shows more than one data set
this button can be used to toggle the display of additional vertical
axis.
Additional axis - when a chart window shows more than one data set
this button can be used to toggle the display of additional vertical
axis. - Sorts the chart in ascending order.
 - Sorts the chart in descending order. - opens Statistical Properties Filter window to accept/reject Package
tickets that have the selected statistical property or properties. Note: This button is enabled only when the Package isn't empty and chart ranges are showing.
- Sorts the chart in descending order. - opens Statistical Properties Filter window to accept/reject Package
tickets that have the selected statistical property or properties. Note: This button is enabled only when the Package isn't empty and chart ranges are showing.![]() Hover mouse cursor above any bar in the chart window to see a
tooltip with detailed information for the corresponding statistical property.
Hover mouse cursor above any bar in the chart window to see a
tooltip with detailed information for the corresponding statistical property.
![]() You can export any chart as a JPG or PNG image using menu File -
Export.
You can export any chart as a JPG or PNG image using menu File -
Export.
Custom Analyzer window provides another way of filter back-testing. You can build a list of ticket filters in this window and apply the filters to past winning numbers draws. Custom Analyzer will then show summary statistics and detailed breakdown of accepted and rejected draws.
Custom Analyzers can be saved to a file on your disk and reopened on next application startup.To create a new Custom Analyzer, click menu File - New - Custom Analyzer. To open an existing Custom Analyzer click menu File - Open File and select Analyzer Files in Files of type combo box at the bottom of file browser window that opens from that menu command.
![]() You can also drag and drop a custom analyzer file into
the main application window to open that analyzer. Custom Analyzer files
have .analyzer extension.
You can also drag and drop a custom analyzer file into
the main application window to open that analyzer. Custom Analyzer files
have .analyzer extension.
You can reuse Custom Analyzers in various lotteries installed on your computer. The following rules apply:
Custom Analyzer window has three different modes. You can switch between the modes by clicking at appropriate buttons at the top of the Custom Analyzer window.
In Design mode you add and customize filters to your custom analyzer. The Design screen is divided into two parts. At the top there is Name & Description pane where you can enter the name and a short description of your custom analyzer. The pane is collapsible by clicking on its header. The lower part of the Design screen is the actual filter list.
![]() You can collapse Name & Description pane to maximize the screen area available for the filter list.
You can collapse Name & Description pane to maximize the screen area available for the filter list.
When creating a new Custom Analyzer its filter list is initially empty. To add a new filter to your custom analyzer, click button Add filter at the top-right corner of Custom Analyzer window. This opens Select Filter window listing all available filters. Select the filter you wish to add and click Select button. The filter is added to the custom analyzer and its settings are available at the lower part of filter list area. Repeat the same steps to add another filter to the custom analyzer.
Another way of adding a filter is using Filters window - simply drag the desired filter from Filters window and drop it into the Custom Analyzer window.
To customize the settings of any filter in the list, click the filter in the table first. The lower part of the Designer window then shows controls for the modification of the settings of the selected filter. Note that filter's description updates automatically in the Description column as you make changes to filter's settings.
![]() You can drag the divider between filters table and
filter settings area to enlarge the upper or the lower part of the
Designer window as needed.
You can drag the divider between filters table and
filter settings area to enlarge the upper or the lower part of the
Designer window as needed.
If you wish to remove a filter from custom analyzer select the filter(s) using your mouse then press Delete key. You can also use menu Edit - Delete.
Note: The filters in the list are numbered in ascending order for better orientation in Summary and Details modes respectively.
Click Summary button at the top of Custom Analyzer window to
see
summary statistics of ticket filters:
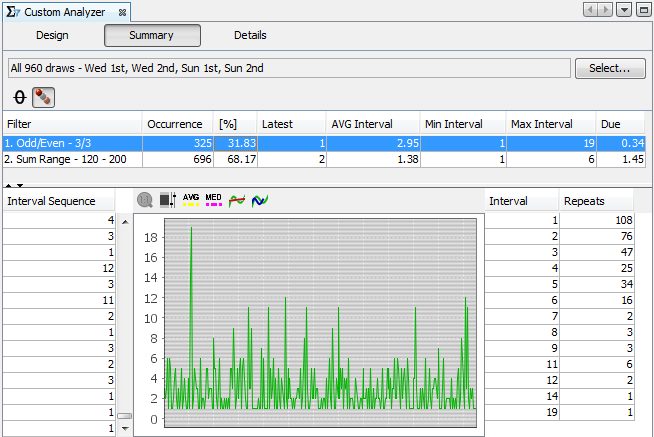
The screen shot above shows summary statistics of Custom
Analyzer which contains two ticket filters:
The summary table is given for the whole winning numbers database in Expert Lotto 6/49 demo lottery. From the table you can see that Odd/Even filter accepts 325 past draws and Sum Range accepts 696 past draws.
The summary table has the same format as statistical tables in
Analyzer window. You can click button to hide rows with
ticket filters that don't accepted any of the selected past draws.
Clicking button shows draw intervals details
for the selected ticket filter.
Click button Select to choose past draws the ticket filters will be applied to.
Click Details button at the top of Custom Analyzer window to see a table of selected past draws showing which ticket filter(s) accept a given draw.
The first table column is draw date, the second table column are winning numbers of given draw. The rest of the table columns are ticket filters. A small x sign denotes that ticket filter accepts given draw while red background highlights draws rejected by the filter.
Note that column headers are too narrow to show full filter name and description so you should use index numbers in column headers to match the table columns with ticket filters in Design mode. You can also hover mouse cursor above any ticket filter column to see its full name and description.
Click button Select to choose past draws the ticket filters will be applied to.
![]() You can change the order of draws in the table by clicking Date column
header.
You can change the order of draws in the table by clicking Date column
header.
![]() Use menu Edit - Find to search for a draw with given numbers.
Use menu Edit - Find to search for a draw with given numbers.
Menu command Tools - Ticket Properties opens Ticket Properties window which displays statistical properties of a single ticket or draw in currently active window:
This way you can display statistical properties of any ticket or draw selected in:
![]() Column header in Ticket Properties window shows the winning numbers of
the draw or the numbers of the Package ticket whose statistical
properties are displayed in that window.
Column header in Ticket Properties window shows the winning numbers of
the draw or the numbers of the Package ticket whose statistical
properties are displayed in that window.
![]() You can customize the list of statistical properties using menu Tools - Options - Statistics.
You can customize the list of statistical properties using menu Tools - Options - Statistics.
Note: Some statistical properties are organized into categories. Double-click appropriate table row to expand or collapse that category.
| Odd/Even |
Ticket Count |
| 0:6 |
134596 |
| 1:5 |
1062600
|
| 2:4 |
3187800 |
| 3:3 |
4655200 |
| 4:2 |
3491400 |
| 5:1 |
1275120 |
| 6:0 |
177100 |
The most common combination of odd and even numbers is 3:3. There are 4,655,200 such tickets in the full wheel of all possible combinations. So from the statistical point of view it should be safe to prefer tickets with this ratio of odd/even numbers when preparing your bet for the next draw.
The same information is available as a bar chart:
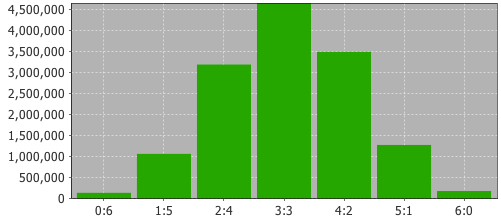
There are many types of summary statistics available in Expert Lotto and most of them have complementary ticket filter to reduce the tickets according to their statistical properties.
To calculate summary statistics, click menu File - New - Analyzer.
See also Statistical Properties.
These statistics track the occurrences of pool number in analyzed tickets.
For example the analysis of Ticket Numbers for 10 latest draws in Expert Lotto 6/49 Demo lottery shows that the most frequent numbers are 32, 36, 40, 41 and 42. Each number occurs twice in the analyzed ten draws. On the other hand the analyzed draws do not contains numbers 3, 4, 7, 9, 10, 21, 27, 34, 39, 45 and 46. The analyzer table shows zero in Occurrence column for these numbers.
![]() When playing e.g. 6/xx lottery you can select six table rows (i.e. six pool numbers) and then click
When playing e.g. 6/xx lottery you can select six table rows (i.e. six pool numbers) and then click ![]() button in the toolbar to add the selected numbers as a new ticket into the Package.
button in the toolbar to add the selected numbers as a new ticket into the Package.
See also Match Numbers ticket filter.
Bonus numbers analysis shows the frequency of bonus or powerball numbers.
For example the latest 10 draws in Expert Lotto 6/49 Demo Lottery are:
| 2010/28 Sun 2nd | 23 | 29 | 36 | 42 | 44 | 47 | [07] |
| 2010/28 Sun 1st | 06 | 13 | 14 | 19 | 41 | 42 | [29] |
| 2010/28 Wed 2nd | 02 | 13 | 16 | 17 | 25 | 40 | [27] |
| 2010/28 Wed 1st | 16 | 18 | 22 | 23 | 28 | 29 | [24] |
| 2010/27 Sun 2nd | 01 | 06 | 12 | 24 | 32 | 41 | [44] |
| 2010/27 Sun 1st | 02 | 15 | 22 | 29 | 30 | 37 | [42] |
| 2010/27 Wed 2nd | 20 | 23 | 25 | 30 | 33 | 35 | [07] |
| 2010/27 Wed 1st | 08 | 11 | 19 | 26 | 48 | 49 | [18] |
| 2010/26 Sun 2nd | 08 | 11 | 18 | 32 | 36 | 38 | [06] |
| 2010/26 Sun 1st | 05 | 06 | 11 | 31 | 40 | 43 | [32] |
So the analyzer table shows occurrence value of 2 for bonus number 7 as it appear two times in the last 10 draws.
See also Bonus Numbers ticket filter.
This statistical analyzer is available only when playing a Pick-N lottery where each winning number comes from a separate pool. It tracks the occurrences of numbers in analyzed tickets regardless of the pool they come from.
For example the analysis of Mixed Pool Numbers for 10 latest draws in Expert
Lotto Pick 3 Demo lottery shows that for example number 0 came up twice - in the first position in draw 21.7.2010 and in draw 12.7.2010 (also in the first position). The most frequent number is 9 occurring five times in positions 1, 2 and 3. The least frequent numbers are 4 and 8.
Bonus numbers analysis shows the frequency of pairs of bonus or powerball numbers in analyzed tickets/draws.
Note: These statistics are available only in lotteries that draw two or more bonus/powerball numbers.
See also Bonus Numbers statistics.
These statistics track the occurrences of odd and even numbers in analyzed tickets.
These statistics are available in summary form and also as per-ticket properties.
See also Odd/Even ticket filter.
These statistics track the occurrences of low and high numbers in analyzed tickets.
Number is low when it is in the lower
half of number pool, number is high when it is in the upper half of
number pool.
For example in a x/40 lottery, numbers 1 to 20 are low, numbers 21
to 40 are high numbers. In a x/49 lottery, numbers 1 to 24 are low,
numbers 25 to 49 are high.
These statistics are available in summary form and also as per-ticket properties.
See also Low/High ticket filter.
Ticket sum statistics track the occurrence of the sum main numbers in analyzed tickets. For example the winning numbers in the latest draw of Expert Lotto 6/49 Demo Lottery are 23-29-36-42-44-47-[07]. So the sum value for that draw is 23+29+36+42+44+47=221.
Sum root is a single digit number ranging from 1 to 9. It is calculated from arithmetic sum of ticket's main numbers by repeatedly summing the digits of the sum value until only a single digit number is left. For example the sum of ticket 11-22-32-35-46-48 is 194. So the Sum Root value is 1+9+4=14 -> 1+4=5.
If you analyze the whole list of all possible number combinations you will see that the Sum Root statistics divides the analyzed tickets into nine evenly-sized groups.
This is sum of odd or even numbers of the analyzed ticket. For example the winning numbers in the latest draw of Expert Lotto 6/49 Demo Lottery are 23-29-36-42-44-47-[07]. So the sum of odd numbers is 23+29 +47=99. Sum of even numbers is 36 + 42 + 44 = 122.
This is sum of low or high numbers of the analyzed ticket. For example the winning numbers in the latest draw of Expert Lotto 6/49 Demo Lottery are 23-29-36-42-44-47-[07]. So the sum of low numbers is 23 because that is the only low number in that draw. Sum of high numbers is 29 + 36 + 42 + 44 + 47 = 198.
This is sum root of ticket's odd or even numbers. For example the winning numbers in the latest draw of Expert Lotto 6/49 Demo Lottery are 23-29-36-42-44-47-[07]. Sum of even numbers is 36 + 42 + 44 = 122. The root of that sum is 1+2+2=5.
This is sum root of ticket's low or high numbers. For example the winning numbers in the latest draw of Expert Lotto 6/49 Demo Lottery are 23-29-36-42-44-47-[07]. So the sum of low numbers is 23 because that is the only low number in that draw. The root of that sum is 2+3=5. Sum of high numbers is 29 + 36 + 42 + 44 + 47 = 198. And the root of that sum is 1+9+8=18 -> 1+8=9.
This is the least significant (last) digit of the value of the sum of analyzed ticket numbers. So if the sum of winning numbers of the latest draw in Expert Lotto 6/49 Demo lottery is 221 (see above), then its last digit is 1. Similar to Sum Root this statistics divides the full set of all possible number combinations into ten evenly sized groups.
This is the sum of all first digits of the analyzed ticket. For example the winning numbers in the latest draw of Expert Lotto 6/49 Demo Lottery are 23-29-36-42-44-47-[07]. So the first digits are 2, 2, 3, 4, 4, 4 and their sum is 19.
This is the sum of all last digits of the analyzed ticket. For example the winning numbers in the latest draw of Expert Lotto 6/49 Demo Lottery are 23-29-36-42-44-47-[07]. So the last digits are 3, 9, 6, 2, 4, 7 and their sum is 31.
This is the sum of all first and last digits of the analyzed ticket. For example the winning numbers in the latest draw of Expert Lotto 6/49 Demo Lottery are 23-29-36-42-44-47-[07]. The sum of the first digits is 19, the sum of last digits is 31 so the sum of all digits is 19+31=50.
This is the sum root of all first digits of the analyzed ticket. For example the winning numbers in the latest draw of Expert Lotto 6/49 Demo Lottery are 23-29-36-42-44-47-[07]. So the first digits are 2, 2, 3, 4, 4, 4 and their sum is 19 with root value of 1.
This is the sum root of all last digits of the analyzed ticket. For example the winning numbers in the latest draw of Expert Lotto 6/49 Demo Lottery are 23-29-36-42-44-47-[07]. So the last digits are 3, 9, 6, 2, 4, 7 and their sum is 31 with root value of 4.
If the lottery draws two or more bonus numbers then this is the sum of all bonus numbers. If the the lottery has just one or no bonus number then these statistics are not available.
All these statistics are available in summary form and also as per-ticket properties.
See also Sum Range, Sum Root, Sum of Odd/Even Numbers, Sum of Low/High Numbers and Sum's Last Digit ticket filters.
These statistics track how many analyzed ticket numbers repeat from previous draws. The statistics show the count numbers repeating from 1, 3, 5 and 10 previous draws.
For example the latest 10 draws in Expert Lotto 6/49 Demo Lottery are:
| 2010/28 Sun 2nd | 23 | 29 | 36 | 42 | 44 | 47 | [07] |
| 2010/28 Sun 1st | 06 | 13 | 14 | 19 | 41 | 42 | [29] |
| 2010/28 Wed 2nd | 02 | 13 | 16 | 17 | 25 | 40 | [27] |
| 2010/28 Wed 1st | 16 | 18 | 22 | 23 | 28 | 29 | [24] |
| 2010/27 Sun 2nd | 01 | 06 | 12 | 24 | 32 | 41 | [44] |
| 2010/27 Sun 1st | 02 | 15 | 22 | 29 | 30 | 37 | [42] |
| 2010/27 Wed 2nd | 20 | 23 | 25 | 30 | 33 | 35 | [07] |
| 2010/27 Wed 1st | 08 | 11 | 19 | 26 | 48 | 49 | [18] |
| 2010/26 Sun 2nd | 08 | 11 | 18 | 32 | 36 | 38 | [06] |
| 2010/26 Sun 1st | 05 | 06 | 11 | 31 | 40 | 43 | [32] |
When analyzing the latest draw 2010/28 Sun 2nd we can see that one number repeats from the previous draw. It's number 42. So the column Repeating Numbers [1] in e.g. Winning Numbers Properties window shows value of 1 for this draw.
When comparing the latest draw with three previous draws, we can see that 3 numbers repeat. Number 42 from previous draw and numbers 23 and 29 from draw 2010/28 Wed 1st (see numbers with blue background in the table above). Therefore the column Repeating Numbers [3] shows value of 3 for this draw.
Comparing the latest draw with 5 previous draws shows that only the same three numbers repeat. So column Repeating Numbers [5] also shows value of 3.
Looking at 10 previous draw we can see there are 5 repeating numbers: 42 from draw 2010/28 Sun 1st, 23 and 29 from draw 2010/28 Wed 1st, 36 from draw 2010/26 Sun 2nd and 47 from draw 2010/26 Wed 2nd. Therefore the column Repeating Numbers [10] shows value of 5 for this draw.
Note: Repeating Numbers properties of Package tickets apply to the selection of past winning numbers made in Options window.
These statistics are available in summary form and also as per-ticket properties.
See also Repeating Numbers ticket filter.
Adjacent numbers are numbers that are one higher or one lower than the winning numbers from the previous draw.
There are two types of Adjacent Numbers statistics. Per ticket statistics compares ticket numbers with previously drawn numbers at any ticket position. Per position statistics compares the ticket numbers at the same ticket position only.
Additional categorization is the distance between adjacent numbers. The distance ranges from 1 to 5. It means Adjacent Numbers [1] are numbers that are one higher or one lower then previous winning numbers. Adjacent Numbers [2] are numbers that are two higher or two lower then previous winning numbers. For example number 15 is adjacent [2] to numbers 13 and 17 respectively. The same applies to Adjacent Numbers [3], [4] and [5] respectively. For example number 31 is adjacent [5] to numbers 26 and 36 respectively.
For example the latest 10 draws in Expert Lotto 6/49 Demo Lottery are:
| 2010/28 Sun 2nd | 23 | 29 | 36 | 42 | 44 | 47 | [07] |
| 2010/28 Sun 1st | 06 | 13 | 14 | 19 | 41 | 42 | [29] |
| 2010/28 Wed 2nd | 02 | 13 | 16 | 17 | 25 | 40 | [27] |
| 2010/28 Wed 1st | 16 | 18 | 22 | 23 | 28 | 29 | [24] |
| 2010/27 Sun 2nd | 01 | 06 | 12 | 24 | 32 | 41 | [44] |
| 2010/27 Sun 1st | 02 | 15 | 22 | 29 | 30 | 37 | [42] |
| 2010/27 Wed 2nd | 20 | 23 | 25 | 30 | 33 | 35 | [07] |
| 2010/27 Wed 1st | 08 | 11 | 19 | 26 | 48 | 49 | [18] |
| 2010/26 Sun 2nd | 08 | 11 | 18 | 32 | 36 | 38 | [06] |
| 2010/26 Sun 1st | 05 | 06 | 11 | 31 | 40 | 43 | [32] |
In the latest draw 2010/28 Sun 2nd there is only one number adjacent
to the numbers of previous draw 2010/28 Sun 1st - number 42 is adjacent
to number 41 in the previous draw.
Draw 2010/28 Sun 1st has two
adjacent numbers - 14 and 41 which are adjacent to numbers 13 and 40 respectively.
Draw 2010/28 Wed 2nd has only one
adjacent number - 17 which is adjacent both to number 16 and to number
18 from the previous draw.
In total there are 7 cases of a single
adjacent number and three draws have two numbers adjacent to numbers
from previous draw. Adjacent numbers are highlighted with blue
background in the table above.
When looking for adjacent numbers [4], we can see that for example draw 2010/28 Wed 1st has two such numbers. Number 16 is adjacent [4] to number 12 and number 28 is adjacent [4] to number 24 from previous draw. Highlighted with red background in the table above.
| 2010/28 Sun 2nd | 23 | 29 | 36 | 42 | 44 | 47 | [07] |
| 2010/28 Sun 1st | 06 | 13 | 14 | 19 | 41 | 42 | [29] |
| 2010/28 Wed 2nd | 02 | 13 | 16 | 17 | 25 | 40 | [27] |
| 2010/28 Wed 1st | 16 | 18 | 22 | 23 | 28 | 29 | [24] |
| 2010/27 Sun 2nd | 01 | 06 | 12 | 24 | 32 | 41 | [44] |
| 2010/27 Sun 1st | 02 | 15 | 22 | 29 | 30 | 37 | [42] |
| 2010/27 Wed 2nd | 20 | 23 | 25 | 30 | 33 | 35 | [07] |
| 2010/27 Wed 1st | 08 | 11 | 19 | 26 | 48 | 49 | [18] |
| 2010/26 Sun 2nd | 08 | 11 | 18 | 32 | 36 | 38 | [06] |
| 2010/26 Sun 1st | 05 | 06 | 11 | 31 | 40 | 43 | [32] |
Blue background in the table above highlights adjacent numbers [1] when comparing by ticket position. When looking for adjacent numbers [5], we can find two such numbers in e.g. draw 2010/26 Sun 2nd. Number 11 is adjacent [5] to number 6 from previous and number 38 is adjacent to previous number 43 at the same position in previous draw. The numbers are highlighted with red background in the table above.
These statistics are available in summary form and also as per-ticket properties.
See also Adjacent Numbers filter.
Adjacent digits are first or last digits that are one higher or one lower than the appropriate digits from previous draw. Each pool number breaks down into two digits. The first digit is the leading digit of the number, the last digit is the second digit of the number. For example the first digit of number 23 is 2, the last digit of that number is 3. The first digit of number 9 is 0, the last digit of that number is 9.
There are two types of Adjacent Digits statistics. Per ticket statistics compares first/last digits with first/last digits at any position in the previous draw. Per position statistics compares the digits at the same ticket position only.
For example the latest 2 draws in Expert Lotto 6/49 Demo Lottery are:
| 2010/28 Sun 2nd | 23 | 29 | 36 | 42 | 44 | 47 | [07] |
| 2010/28 Sun 1st | 06 | 13 | 14 | 19 | 41 | 42 | [29] |
There are four last digits in draw 2010/28 Sun 2nd that are adjacent to previous draw 2010/28 Sun 1st. Last digit 3 of number 23 is adjacent to previous numbers 14 and 42 (last digitis 4 and 2). Last digit of number 42 is adjacent to previous numbers 13 and 41 (last digits 3 and 1). Last digit 4 of number 44 is adjacent to previous number 13 (last digit 3). Last digit 7 of number 47 is adjacent to number 6 (last digit 6).
When comparing the same two draws listed above per ticket positions, we can see that there no adjacent last digits. Only one first digit is adjacent to the first digits from previous draw at the same ticket position. The first digit of number 29 is 2 which is adjacent to the first digit 1 of number 13 from the previous draw at the same ticket position.
These statistics are available in summary form and also as per-ticket properties.
See also Adjacent Digits filter.
With combined statistics it is possible to group up to five different statistics into a new, single statistical property and thus track the combination of statistical properties as a single event. Expert Lotto ships with three predefined combined statistics:
Use menu Tools - Options - Statistics to define new combined statistics or to customize the existing ones.
These statistics track the occurrence of combinations of odd/even numbers and low/high numbers.
Ticket 1-2-3-4-5-6 has 3 odd numbers and 3 even numbers. All its numbers are low. So the Odd/Even + Low/High column in e.g. Package Properties window shows value 3:3 - 6:0 for this ticket.
The latest winning numbers in Expert Lotto 6/49 Demo Lottery are 23-29-36-42-44-47-[07]. Three numbers are odd and three numbers are even, 1 number is low (23) and five numbers are high. So the Odd/Even + Low/High column in e.g. Winning Numbers Properties window shows value 3:3 - 1:5 for this draw.
These statistics are available in summary form and also as per-ticket properties.
See also Combined Statistics and Odd/Even and Low/High ticket filters.
These statistics track the occurrence of combinations of sum root values and odd/even numbers.
The sum of ticket numbers 1-2-3-4-5-6 is 27. Sum root value is then 2+7=9. Three numbers are odd and three numbers are even. So the Sum Root + Odd/Even column in e.g. Package Properties window shows value 7 - 3:3 for this ticket.
The latest winning numbers in Expert Lotto 6/49 Demo Lottery are 23-29-36-42-44-47-[07]. The sum of these numbers is 221 therefore the sum root value is 2+2+1 = 5. Three numbers are odd and three numbers are even. So the Sum Root + Odd/Even column in e.g. Winning Numbers Properties window shows value 5 - 3:3 for this draw.
These statistics are available in summary form and also as per-ticket properties.
See also Combined Statistics and Sum Root and Odd/Even ticket filters.
These statistics track the occurrence of combinations of sum root values and low/high numbers.
The sum of ticket numbers 1-2-3-4-5-6 is 27. Sum root value is then 2+7=9. All the numbers are low. So the Sum Root + Low/High column in e.g. Package Properties window shows value 7 - 6:0 for this ticket.
The latest winning numbers in Expert Lotto 6/49 Demo Lottery are 23-29-36-42-44-47-[07]. The sum of these numbers is 221 therefore the sum root value is 2+2+1 = 5. One number is low (23) and five numbers are high. So the Sum Root + Low/High column in e.g. Winning Numbers Properties window shows value 5 - 1:5 for this draw.
These statistics are available in summary form and also as per-ticket properties.
See also Combined Statistics and Sum Root and Low/High ticket filters.
These statistics show the best match of the analyzed ticket that was found in 5, 10 and 15 latest draws.
For example the latest 10 draws in Expert Lotto 6/49 Demo Lottery are:
| 2010/28 Sun 2nd | 23 | 29 | 36 | 42 | 44 | 47 | [07] |
| 2010/28 Sun 1st | 06 | 13 | 14 | 19 | 41 | 42 | [29] |
| 2010/28 Wed 2nd | 02 | 13 | 16 | 17 | 25 | 40 | [27] |
| 2010/28 Wed 1st | 16 | 18 | 22 | 23 | 28 | 29 | [24] |
| 2010/27 Sun 2nd | 01 | 06 | 12 | 24 | 32 | 41 | [44] |
| 2010/27 Sun 1st | 02 | 15 | 22 | 29 | 30 | 37 | [42] |
| 2010/27 Wed 2nd | 20 | 23 | 25 | 30 | 33 | 35 | [07] |
| 2010/27 Wed 1st | 08 | 11 | 19 | 26 | 48 | 49 | [18] |
| 2010/26 Sun 2nd | 08 | 11 | 18 | 32 | 36 | 38 | [06] |
| 2010/26 Sun 1st | 05 | 06 | 11 | 31 | 40 | 43 | [32] |
When the latest draw 2010/28 Sun 2nd (orange background) is compared to 5 previous draws (blue background) then the best match found is two numbers. Numbers 23 and 29 in the latest draw repeat in draw 2010/28 Wed 1st. So the table cell in column Match Previous 5 in Winning Numbers Properties window shows value of 2 for the latest draw.
When calculating the same property for draw 2010/28 Wed 2nd then its winning numbers are compared with draws 2010/28 Wed 1st to 2010/27 Wed 1st and the best match found is just one number. For example number 16 from the previous draw or number 2 from draw 2010/27 Sun 1st. So the table cell in column Match Previous 5 in Winning Numbers Properties window shows value of 1 for this draw.
Column Match Previous 10 shows the best match found in ten previous draws and column Match Previous 15 shows the best match found in fifteen previous draws.
Note: The corresponding values in Package Properties window apply to the selection of past winning numbers made in Options window.
These statistics are available in summary form and also as per-ticket properties.
See also Match Winning Numbers and Highest Match ticket filters.
These statistics show the maximum count of numbers each analyzed ticket or draw has in ticket panel's row and in ticket panel's column.
For example when analyzing the latest draw in Expert Lotto 6/49 Demo Lottery with winning numbers 23-29-36-42-44-47-[7] then column Max In Row in e.g. Winning Numbers Properties window shows value 2 because there are at most two numbers at any row in Ticket Panel window. Column Max In Column in the same window shows value 2 because there are at most two numbers in any column in Ticket Panel window.
These statistics are available in summary form and also as per-ticket properties.
See also Ticket Panel filter.
This statistics count how many consecutive draws each pool numbers appear in.
For example the last 10 draws in Expert Lotto 6/49 Demo Lottery are:
| 2010/28 Sun 2nd | 23 | 29 | 36 | 42 | 44 | 47 | [07] |
| 2010/28 Sun 1st | 06 | 13 | 14 | 19 | 41 | 42 | [29] |
| 2010/28 Wed 2nd | 02 | 13 | 16 | 17 | 25 | 40 | [27] |
| 2010/28 Wed 1st | 16 | 18 | 22 | 23 | 28 | 29 | [24] |
| 2010/27 Sun 2nd | 01 | 06 | 12 | 24 | 32 | 41 | [44] |
| 2010/27 Sun 1st | 02 | 15 | 22 | 29 | 30 | 37 | [42] |
| 2010/27 Wed 2nd | 20 | 23 | 25 | 30 | 33 | 35 | [07] |
| 2010/27 Wed 1st | 08 | 11 | 19 | 26 | 48 | 49 | [18] |
| 2010/26 Sun 2nd | 08 | 11 | 18 | 32 | 36 | 38 | [06] |
| 2010/26 Sun 1st | 05 | 06 | 11 | 31 | 40 | 43 | [32] |
The table above shows that number 8 hit in two consecutive rows
(2010/26 Sun 2nd and 2010/27 Wed 1st), so the analyzer table for
Consecutive Draws shows value 1 in column 2 for number 8.
Number 11 hit in three draws in a row (see numbers in bold in the table
above) so the analyzer table for Consecutive Draws shows values 1 in
column 3 for number 11.
Also numbers 13, 16, 30 and 42 hit in two consecutive draws to the
analyzer table shows value 1 in column 2 in corresponding rows. Other
table cells are empty because no other number hit again in the
following draw in the selected section of winning numbers database.
When analyzing the whole winning numbers database of Expert Lotto
6/49 Demo Lottery you can see that the most repeating numbers is 17
which hit in six draws in a row. It happened in draws 2008/5 Sun 1st to
2008/6 Sun 2nd.
These statistics track how many times each pool number was drawn with other pool numbers. It is very similar to Pairs analysis except that the results are presented as a number grid instead.
Let's analyze 10 latest draws in Expert Lotto 6/49 Demo Lottery:
| 2010/28 Sun 2nd | 23 | 29 | 36 | 42 | 44 | 47 | [07] |
| 2010/28 Sun 1st | 06 | 13 | 14 | 19 | 41 | 42 | [29] |
| 2010/28 Wed 2nd | 02 | 13 | 16 | 17 | 25 | 40 | [27] |
| 2010/28 Wed 1st | 16 | 18 | 22 | 23 | 28 | 29 | [24] |
| 2010/27 Sun 2nd | 01 | 06 | 12 | 24 | 32 | 41 | [44] |
| 2010/27 Sun 1st | 02 | 15 | 22 | 29 | 30 | 37 | [42] |
| 2010/27 Wed 2nd | 20 | 23 | 25 | 30 | 33 | 35 | [07] |
| 2010/27 Wed 1st | 08 | 11 | 19 | 26 | 48 | 49 | [18] |
| 2010/26 Sun 2nd | 08 | 11 | 18 | 32 | 36 | 38 | [06] |
| 2010/26 Sun 1st | 05 | 06 | 11 | 31 | 40 | 43 | [32] |
Both row headers and column headers in this table are pool numbers.
Values in appropriate table cells show how many times the given number
was drawn with the other number. For example row 6 and column 41 show
value of 2 which means that number 6 hit together with number 41 in two
draws (2010/28 Sun 1st and 2010/27 Sun 2nd - see blue cells in the table above). Table cell in row 41 and
column 6 has the same meaning.
Table cell under row 1 and column 2 shows value zero which means that
numbers 1 and 2 have never been drawn together in the analyzed 10 draws.
Both row headers and column headers in this table are pool numbers. Table cell values show how many draws elapsed since the given numbers have been drawn together. For example row 6 and column 1 shows value of 5 which means that numbers 1 and 6 were drawn together five draws ago (draw 2010/27 Sun 2nd). Table cell at coordinates 23 and 29 shows value 1 which means that numbers 23 and 29 were drawn together at the very latest draw. The same meaning has cell at coordinates 29 and 23.
The cells in this table contain all possible number pairs. Column headers show how many times the pairs in given column were found in analyzed draws. Number pairs in column 0 have never been drawn in analyzed draws, pairs in column 1 hit just once in analyzed draws, pairs in column 2 hit twice etc. So this table is basically an inversion of Number Matrix table.
You can toggle Column Range button and then choose to display only a selected column range using Min and Max spinner fields.
The cells in this table contain all possible number pairs. Column headers show how many draws elapsed since the last occurrence of the pairs in given column. Number pairs in column n/a have never been drawn, pairs in column 1 hit in the very latest draw, pairs in column 2 hit two draws ago etc. So this table is basically an inversion of Latest Draws table.
You can toggle Column Range button and then choose to display only a selected column range using Min and Max spinner fields.
![]() Click any column header in any table to sort it in ascending or
descending order.
Click any column header in any table to sort it in ascending or
descending order.
Knight's Move statistics compare the winning numbers of analyzed draw/ticket with the winning numbers from the previous draw. The statistics then show how many numbers from the previous draw made chess-like knight's move into the analyzed draw. Knight's move is defined as follows:
Let's arrange all pool numbers into a grid with 10 columns:
1 |
2 |
3 |
4 |
5 |
6 |
7 |
8 |
9 |
10 |
11 |
12 |
13 |
14 |
15 |
16 |
17 |
18 |
19 |
20 |
21 |
22 |
23 |
24 |
25 |
26 |
27 |
28 |
29 |
30 |
31 |
32 |
33 |
34 |
35 |
36 |
37 |
38 |
39 |
40 |
41 |
42 |
43 |
44 |
45 |
46 |
47 |
48 |
49 |
As you can see, number 1 can make L-shaped knight's move to numbers 13 or 22 respectively. For example number 28 can jump to numbers 7, 9, 16, 20, 36, 40, 47, 49 - highlighted with blue background in the table above. The same rules apply to other pool numbers.
The statistics are given for the whole analyzed ticket and also per-position when the analyzed numbers are compared with previously drawn numbers at the same ticket positions.
Let's look at the following two draws in Expert Lotto 6/49 Demo lottery:
| 2010/28 Wed 1st | 16 | 18 | 22 | 23 | 28 | 29 | [24] |
| 2010/27 Sun 2nd | 01 | 06 | 12 | 24 | 32 | 41 | [44] |
Per-ticket Knight's Move statistics for draw 2010/28 Wed 1st show that there 3 numbers that knight-moved from the previous draw. Number 24 from previous draw jumped to number 16 in the analyzed draw. Number 6 made L-shaped move to number 18 and number 41 jumped to number 22.
When we compare the numbers at the same ticket positions then there's only number 6 at the second ticket position which jumped to number 18 at the same ticket position.
These statistics are available in summary form and also as per-ticket properties.
See also Knight's Move filter.
Ticket index is a number which uniquely identifies the ticket in the set of all possible number combinations. For example in 6/49 lottery, the ticket index 1 is equal to number combination 1-2-3-4-5-6, ticket index 2 equals to number combination 1-2-3-4-5-7, ticket index 3 is number combination 1-2-3-4-5-8 etc. Ticket numbers 44-45-46-47-48-49 have ticket index of 13,983,816.
Ticket Index Range statistics divide the whole interval of all possible ticket index values into several ranges. Each row in the analyzer table represents one ticket index range. The summary statistics then show how many analyzed tickets fall into each ticket index range.
See also Ticket Index Range filter.
This summary statistics shows the relative distance of analyzed ticket from the latest draw (when analyzing Package tickets) or from the previous draw (when analyzing winning numbers draws) in the full list of all possible combinations.
For example in a 6/49 lottery there are 13,983,816 possible combinations starting with number combination 1-2-3-4-5-6 which has ticket index 1, then number combination 1-2-3-4-5-7 which has ticket index 2, up to the last possible combination 44-45-46-47-48-49 which has ticket index 13,983,816.
Ticket index movement than compares the index of the latest draw (or the index of previous draw) with the index of the analyzed ticket. The lowest possible value is 0.0 which means that the analyzed ticket has the same numbers as the latest/previous draw. The highest possible value is 0.999999999. This happens only if the analyzed ticket numbers are 1-2-3-4-5-6 and the latest winning numbers are 44-45-46-47-48-49 or vice versa.
The statistical table divides the whole possible range of ticket index movement values into 100 equal sub-ranges. The first table row shows how many analyzed tickets/draws fit into ticket index movement range 0.0 to 0.01 (exclusive), the second row shows the occurrence of ticket index movement in the range 0.01 (inclusive) to 0.02 (exclusive) etc.
See also Ticket Index Movement filter and Ticket Index Movement statistical property.
Ticket index is a number which uniquely identifies the ticket in the set of all possible number combinations. For example in 6/49 lottery, the ticket index 1 is equal to number combination 1-2-3-4-5-6, ticket index 2 equals to number combination 1-2-3-4-5-7, ticket index 3 is number combination 1-2-3-4-5-8 etc. Ticket numbers 44-45-46-47-48-49 have ticket index of 13,983,816.
That means there are 8 different positions. Positions of ticket index value of 1 are 0, 0, 0, 0, 0, 0, 0 and 1 and positions in ticket index 13,983,816 are 1,3,9,8,3,8,1 and 6.
The statistics then show how many times a digit 0 to 9 appears at individual ticket index positions.These statistics are available in summary form and also as per-ticket properties.
See also Ticket Index Position filter.
These statistics give the count of prime numbers in analyzed tickets.
Prime numbers in the range of 1 to 100 are 2, 3, 5, 7, 11, 13, 17, 19, 23, 29, 31, 37, 41, 43, 47, 53, 59, 61, 67, 71, 73, 79, 83, 89, 97
These statistics are available in summary form and also as per-ticket properties.
Arithmetic complexity shows the variations of differences between the numbers of analyzed tickets. The formulae is:
Arithmetic Complexity(t) = D(t) - (r-1)
where D(t) is the count of unique differences between all ticket numbers and r is the count of numbers in the analyzed ticket.
In a 6/xx lottery the Arithmetic Complexity value ranges from 0 to 10. About 74% of all possible combinations have the Arithmetic Complexity value in the range of 8 to 10.
Let's analyze ticket 1-2-3-4-5-6. The differences between all ticket numbers are:
2-1 = 1
3-1 = 2
4-1 = 3
5-1 = 4
6-1 = 5
3-2 = 1
4-2 = 2
5-2 = 3
6-2 = 4
4-3 = 1
5-3 = 2
6-3 = 3
5-4 = 1
6-4 = 2
6-5 = 1
There are 5 unique differences: 1, 2, 3, 4, 5 so the Arithmetic Complexity of this ticket is 5-(6-1) = 0
The same analysis of ticket 1-2-4-8-13-21 shows the following differences:
2-1 = 1
4-1 = 3
8-1 = 7
13-1 = 12
21-1 = 20
4-2 = 2
8-2 = 6
13-2 = 11
21-2 = 19
8-4 = 4
13-4 = 9
21-4 = 17
13-8 = 5
21-8 = 13
21-13 = 8
None of the differences above repeat so there are 15 unique differences so the Arithmetic Complexity of this ticket is 15-(6-1)=10
These statistics are available in summary form and also as per-ticket properties.
See also Arithmetic Complexity filter.
This statistics gives the maximum count of first and last digits that are consecutive regardless of their order within the analyzed tickets.
Each pool number breaks down into two digits. The first digit is the leading digit of the number, the last digit is the second digit of the number. For example the first digit of number 23 is 2, the last digit of that number is 3. The first digit of number 9 is 0, the last digit of that number is 9.
For example the latest draw in Expert Lotto 6/49 Demo lottery is 23-29-36-42-44-47. The first digits of that draw are 2, 2, 3, 4, 4, 4. The longest sequence of consecutive digits is 2-3-4 so the value of Consecutive First Digits (any order) for the latest draw is 3.
The last digits of the latest draw are 3, 9, 6, 2, 4, 7. When sorted in ascending order the last digits are 2, 3, 4, 6, 7, 9. We can see that the longest consecutive sequence is 2-3-4 so the value of Consecutive Last Digits (any order) for the latest draw is 3.
These statistics are available in summary form and also as per-ticket properties.
See also Consecutive Digits In Any Order ticket filter.
Digits Per Ticket summary statistics shows the frequency of first/last digits in analyzed tickets.
The table below shows the statistical analysis of First Digits of all draws in Expert Lotto 6/49 Demo lottery:
| First Digits | Occurrence |
| 0 | 1093 |
| 1 | 1162 |
| 2 | 1155 |
| 3 | 1210 |
| 4 | 1140 |
| 5 | 0 |
| 6 | 0 |
| 7 | 0 |
| 8 | 0 |
| 9 | 0 |
You can see that first digits 5 to 9 are not present because it is x/49 lottery and the highest possible number is 49. You can also see that the most frequent first digit is 3. That indicates that the most frequent winning numbers are from the range 30 to 39.
Similar table is available for the last digits.
See also First/Last Digits filter.
These statistics track how numbers in analyzed tickets fall into user-defined number groups.
For example the default number groups in Expert Lotto 6/49 Demo Lottery are
When analyzing e.g. the latest draw in Expert Lotto 6/49 Demo Lottery with winning numbers 23-29-36-42-44-47-[07] then column Number Groups Distribution in e.g. Winning Numbers Properties windows shows value 0-0-2-1-3. It means that analyzed draw has zero numbers from Group 1, zero numbers from Group 2, two numbers (23 and 29) from Group 3, one number (36) from Group 4 and two numbers (44 and 47) from Group 5.
Number Group Count column in the same window shows how many groups the analyzed numbers fall in. In this case the latest draw has numbers from three different groups (Group 3, Group 4 and Group 5) so that column shows value of 3 for the latest draw.
These statistics are available in summary form and also as per-ticket properties.
See also Number Group and Number Groups Patterns filters and Number Groups Distribution and Number Group Repeats statistics.
These statistics show all possible number groups distributions that ticket numbers can create and how many times such distribution values have been found in analyzed tickets.
For example the default number groups in Expert Lotto 6/49 Demo Lottery are
When analyzing e.g. the latest draw in Expert Lotto 6/49 Demo Lottery with winning numbers 23-29-36-42-44-47-[07] then Number Groups Distribution analyzer will show value "1" in the Latest column for row labeled 0-0-2-1-3. It means that the latest analyzed draw has zero numbers from Group 1, zero numbers from Group 2, two numbers (23 and 29) from Group 3, one number (36) from Group 4 and two numbers (44 and 47) from Group 5.
These statistics are available in summary form and also as per-ticket properties.
See also Number Group and Number Groups Patterns filters and Number Groups and Number Group Repeats statistics.
This statistical property tracks the occurrences of pool numbers at individual ticket positions.
When analyzing e.g. the latest draw in Expert Lotto 6/49 Demo Lottery with winning numbers 23-29-36-42-44-47-[7] then column Position 1 in e.g. Winning Numbers Properties window shows value of 23. Column Position 2 shows value of 29 because the second ticket number is 29 etc.See also Numbers at Positions ticket filter and Ticket Numbers statistics.
These statistics track the occurrences of first and last digits at individual ticket positions. Each pool number breaks down into two digits. The first digit is the leading digit of the number, the last digit is the second digit of the number. For the first digit of number 23 is 2, the last digit of that number is 3. The first digit of number 9 is 0, the last digit of that number is 9.
For example in Expert Lotto 6/49 Demo Lottery the 10 latest draws are:
| 2010/28 Sun 2nd | 23 | 29 | 36 | 42 | 44 | 47 | [07] |
| 2010/28 Sun 1st | 06 | 13 | 14 | 19 | 41 | 42 | [29] |
| 2010/28 Wed 2nd | 02 | 13 | 16 | 17 | 25 | 40 | [27] |
| 2010/28 Wed 1st | 16 | 18 | 22 | 23 | 28 | 29 | [24] |
| 2010/27 Sun 2nd | 01 | 06 | 12 | 24 | 32 | 41 | [44] |
| 2010/27 Sun 1st | 02 | 15 | 22 | 29 | 30 | 37 | [42] |
| 2010/27 Wed 2nd | 20 | 23 | 25 | 30 | 33 | 35 | [07] |
| 2010/27 Wed 1st | 08 | 11 | 19 | 26 | 48 | 49 | [18] |
| 2010/26 Sun 2nd | 08 | 11 | 18 | 32 | 36 | 38 | [06] |
| 2010/26 Sun 1st | 05 | 06 | 11 | 31 | 40 | 43 | [32] |
First Digit analysis shows that the most frequent digit at the first
ticket position is 0. It is because seven of the analyzed draws have
the first drawn number lower than 10. That means the first digit is 0 - highlighted with blue background in the table above.
The
same analysis of Last Digits shows that the most frequent last digits
at ticket position 6 are digits 7 and 9 - highlighted with orange
background in the table above.
These statistics are available in summary form and also as per-ticket properties.
See also Positional First/Last Digit filter.
These statistics compare the winning numbers of analyzed draw with winning numbers from previous draw. When analyzing Package tickets then the ticket numbers are compared with the latest draw from the selection of past winning numbers draws made in Options window.
For example the winning numbers of the latest draw in Expert Lotto 6/49 Demo Lottery are 23-29-36-42-44-47-[07], winning numbers from the previous draw are 06-13-14-19-41-42-[29]. So number movement at the first ticket position is 23-6=17, number movement at the second ticket position is 29-13=16, movement at the third ticket position is 36-14=22 etc. The sum of all number movement values is 17+16+22+23+3+5=86
When analyzing Package ticket, e.g. 21-27-36-38-41-48 then number movement corresponding to the latest draw will be 21-23=-2 at the first ticket position, 27-29=-2 at the second ticket position, 36-36=0 at the third position etc. The sum of all number movement values is -2-2+0-4-3+1=-10.
These statistics are available in summary form and also as per-ticket properties.
See also Number Movement filter.
Number Movement Patterns compares the number of analyzed draw/ticket with the winning numbers of the previous draw.
For example the latest three draws in Expert Lotto 6/49 Demo lottery are:
| 2010/28 Sun 2nd | 23 | 29 | 36 | 42 | 44 | 47 | [07] |
| 2010/28 Sun 1st | 06 | 13 | 14 | 19 | 41 | 42 | [29] |
| 2010/28 Wed 2nd | 02 | 13 | 16 | 17 | 25 | 40 | [27] |
The Number Movement Pattern for draw 2010/28 Sun 2nd is ++++++ because all its winning numbers are greater than numbers at appropriate position in the previous draw.
The movement pattern for draw 2010/28 Sun 1st is +=-+++. The first winning number is 6 which is greater than number 2 at previous draw, so the first part of number movement pattern value is "+". The second number, 13, is the same as in previous draw, so the pattern continues with "=" sign. Number 14 is lower than number 16 at the same position in previous draw, so the next part of movement pattern is "-". The rest of the winning numbers are greater than the numbers in previous draw, so the movement pattern ends with "+++".
These statistics are available in summary form and also as per-ticket properties.
See also Digits Movement Patterns statistics and Number Movement Pattern filter.
Digits Movement shows how first/last digits changed when compared with previous draw.
For example the latest two draws in Expert Lotto 6/49 Demo lottery are:
| 2010/28 Sun 2nd | 23 | 29 | 36 | 42 | 44 | 47 | [07] |
| 2010/28 Sun 1st | 06 | 13 | 14 | 19 | 41 | 42 | [29] |
So the movement of first digits in draw 2010/28 Sun 2nd is ++++==
That means the first digits at the first four ticket positions are greater than first digits at the same positions in previous draw. And that the last two first digits are the same as in previous draw.
The movement of last digits in the same draw is -++-++
That means the last digit at the first ticket position is lower than in the previous draw (see the last digit 3 in the latest draw and the last digit 6 in the previous draw). The next two ticket positions have higher last digits. The last digit of number 42 in the latest draw is 2 which is lower than the last digit 9 of number 19 from the previous draw. Hence "-" sign in the property value. The last two last digits are greater than the last digits in the previous draw.
These statistics are available in summary form and also as per-ticket properties.
See also Number Movement Patterns and Digits Movement Patterns filter.
These statistics analyze the difference of ticket numbers at neighboring ticket positions.
For example in Expert Lotto 6/49 Demo Lottery the 10 latest draws are:
| 2010/28 Sun 2nd | 23 | 29 | 36 | 42 | 44 | 47 | [07] |
| 2010/28 Sun 1st | 06 | 13 | 14 | 19 | 41 | 42 | [29] |
| 2010/28 Wed 2nd | 02 | 13 | 16 | 17 | 25 | 40 | [27] |
| 2010/28 Wed 1st | 16 | 18 | 22 | 23 | 28 | 29 | [24] |
| 2010/27 Sun 2nd | 01 | 06 | 12 | 24 | 32 | 41 | [44] |
| 2010/27 Sun 1st | 02 | 15 | 22 | 29 | 30 | 37 | [42] |
| 2010/27 Wed 2nd | 20 | 23 | 25 | 30 | 33 | 35 | [07] |
| 2010/27 Wed 1st | 08 | 11 | 19 | 26 | 48 | 49 | [18] |
| 2010/26 Sun 2nd | 08 | 11 | 18 | 32 | 36 | 38 | [06] |
| 2010/26 Sun 1st | 05 | 06 | 11 | 31 | 40 | 43 | [32] |
Number Distance analysis shows that the most frequent distance between numbers at the second and the first ticket positions is 3. It was found in three analyzed draws - see table cells with blue background above. The same analysis also shows that the most frequent distance between numbers at ticket position 6 and 5 is 1. It was found in 3 analyzed draws - see table cells with orange background above.
Number Distance statistical properties of the latest draw in e.g. Winning Numbers Properties window show the Distance 2-1 is 6. Second number 29 minus the first number 23 equals 6. Value in Distance 3-2 column is 7 because 36-29=7. The same applies to other ticket positions.
Distance 1-0 is just a convenience value showing the number at the first ticket position.
Distance 6-1 is the distance between the last ticket number and the first ticket number (in a 6/xx lottery).
These statistics are available in summary form and also as per-ticket properties.
Shows the sum of the first digit and the last digit at all ticket positions.
For example the latest numbers in Expert Lotto 6/49 demo lottery are 23-29-36-42-44-47-[7]. The digits sums for this ticket will be:
Digits Sum 1: 2+3=5
Digits Sum 2: 2+9=11
Digits Sum 3: 3+6=9
Digits Sum 4: 4+2=6
Digits Sum 5: 4+4=8
Digits Sum 6: 4+7=11
All these statistics are available in summary form and also as per-ticket properties.
Shows the sums of all number pairs in an analyzed ticket. The results will be the sum of number at the first ticket position and number at the second ticket position. Then the sum of the first number and the third number, the sum of first number and fourth number and so on up to the sum of the fifth number and the sixth number (in a 6/xx lottery).
For example the latest numbers in Expert Lotto 6/49 demo lottery are 23-29-36-42-44-47-[7]. The position pairs sums for this ticket will be:
Positions 1+2: 23+29=52
Positions 1+3: 23+36=59
Positions 1+4: 23+42=65
Positions 1+5: 23+44=67
Positions 1+6: 23+47=70
Positions 2+3: 29+36=65
Positions 2+4: 29+42=71
Positions 2+5: 29+44=73
Positions 2+6: 29+47=76
Positions 3+4: 36+42=78
Positions 3+5: 36+44=80
Positions 3+6: 36+47=83
Positions 4+5: 42+44=86
Positions 4+6: 42+47=89
Positions 5+6: 44+47=93
All these statistics are available in summary form and also as per-ticket properties.
Number Range statistics divide the whole number pool into several chunks. Each chunk has either 5 or 10 numbers. So when playing e.g. x/49 lottery the pool will be divided into ten chunks of five numbers (1-5, 6-10, 11-15, ... , 41-45, 46-49) and five chunks of ten numbers (1-10, 11-20, ... , 41-49).
The statistics evaluate each ticket position and show which chunk the number at the given position fall into.
For example the latest draw in Expert Lotto 6/49 Demo Lottery is 23-29-36-42-44-47 so when using 5-number ranges the first number falls into range 21-25. When using 10-number ranges the first number falls into range 21-30.
These statistics are available in summary form and also as per-ticket properties.
Vertical Pair Sum statistics track the sum of a ticket number at a given position and a number at the same position in selected previous draw. The distance between the draws being compared is adjustable in Options window.
When the draw distances are set to 1, 5 and 10 in the Options then Winning Numbers Properties window will show for example the following values in Expert Lotto 6/49 Demo Lottery:
| Vertical Pair Sum 1 [1] | Vertical Pair Sum 3 [5] | Vertical Pair Sum 6 [10] | ||||||||
| 2010/28 Sun 2nd | 23 | 29 | 36 | 42 | 44 | 47 | [07] | 29 | 58 | 94 |
| 2010/28 Sun 1st | 06 | 13 | 14 | 19 | 41 | 42 | [29] | 8 | 39 | 88 |
| 2010/28 Wed 2nd | 02 | 13 | 16 | 17 | 25 | 40 | [27] | 18 | 35 | 83 |
| 2010/28 Wed 1st | 16 | 18 | 22 | 23 | 28 | 29 | [24] | 17 | 40 | 75 |
| 2010/27 Sun 2nd | 01 | 06 | 12 | 24 | 32 | 41 | [44] | 3 | 23 | 90 |
| 2010/27 Sun 1st | 02 | 15 | 22 | 29 | 30 | 37 | [42] | 22 | 48 | 77 |
| 2010/27 Wed 2nd | 20 | 23 | 25 | 30 | 33 | 35 | [07] | 28 | 50 | 84 |
| 2010/27 Wed 1st | 08 | 11 | 19 | 26 | 48 | 49 | [18] | 16 | 47 | 88 |
| 2010/26 Sun 2nd | 08 | 11 | 18 | 32 | 36 | 38 | [06] | 13 | 42 | 79 |
| 2010/26 Sun 1st | 05 | 06 | 11 | 31 | 40 | 43 | [32] | 9 | 34 | 91 |
| 2010/26 Wed 2nd | 04 | 18 | 26 | 33 | 35 | 47 | [11] | 9 | 48 | 89 |
Value in column Vertical Pair Sum 1 [1] shows the sum of ticket numbers at the first ticket positions when the draw distance is 1.
Value in column Vertical Pair Sum 3 [5] shows the sum of ticket numbers at the third ticket positions when the draw distance is 5.
Value in column Vertical Pair Sum 6 [5] shows the sum of ticket numbers at the last ticket positions when the draw distance is 10.
These statistics are available in summary form and also as per-ticket properties.
See also Vertical Pairs Filter.
This statistical property shows the average difference between ticket numbers at neighboring ticket positions.
For example the winning numbers in the latest draw of the Expert Lotto 6/49 Demo lottery are 23-29-36-42-44-47. The distance between the second and the first numbers is 29-23=6. The distance of the third number from the second number is 36-29=7. So the distance values are 6, 7, 6, 2, 5, the average distance value is then 4.8
See also Average Distance filter.
Winning numbers of each draw divide the number pool into six consecutive ranges (applies to 6/xx lottery). If the latest winning numbers are for example 23-29-36-42-44-47 then the ranges are:1 to 23,
24 to 29,
30 to 36,
37 to 42,
43 to 44 and
45 to 49.
For example ticket 15-25-31-33-41-49 then has the following distribution pattern: XXX--X. The first number 15 fits into the first range (1 to 23) so the first part of the pattern is X. Second number 25 also fits into the second range (24 to 29) so the pattern continues with X. Number 31 is in the second range so the pattern has X at the third position. Numbers 31 and 41 do not fit into ranges at appropriate positions so the pattern shows - at fourth and fifth positions. The last number 49 fits into the last range so the last part of the distribution pattern is X. In total there are 4 numbers that fit into ranges of the previous draw.
Note: The first range always starts with the lowest pool number. The last number range always ends with the highest pool number.
For example the latest 5 draws in Expert Lotto 6/49 Demo Lottery and their distribution patterns are:
2010/28 Sun 2nd, 23-29-36-42-44-47-[07] -----X
2010/28 Sun 1st, 06-13-14-19-41-42-[29] -XX--X
2010/28 Wed 2nd, 02-13-16-17-25-40-[27] X---XX
2010/28 Wed 1st, 16-18-22-23-28-29-[24] ---XX-
2010/27 Sun 2nd, 01-06-12-24-32-41-[44] XX-X-X
Looking at the table above we can see that for example only the last number (47) of the latest draw fits into ranges defined by the previous draw 2010/28 Sun 1st. The matching range is 42 to 47. The distribution pattern of the latest draw is then -----X.
These statistics track how many analyzed ticket numbers fit into ranges defined by the numbers of the previous draw.
For example the latest 5 draws in Expert Lotto 6/49 Demo Lottery are:
| Date | Numbers | In Range Count | ||||||
| 2010/28 Sun 2nd | 23 | 29 | 36 | 42 | 44 | 47 | [07] | 1 |
| 2010/28 Sun 1st | 06 | 13 | 14 | 19 | 41 | 42 | [29] | 3 |
| 2010/28 Wed 2nd | 02 | 13 | 16 | 17 | 25 | 40 | [27] | 3 |
| 2010/28 Wed 1st | 16 | 18 | 22 | 23 | 28 | 29 | [24] | 2 |
| 2010/27 Sun 2nd | 01 | 06 | 12 | 24 | 32 | 41 | [44] | 4 |
From the table above we can see that this statistics simply gives the count of X symbols in Range Patterns distribution.
For example the latest draw 2010/28 Sun 2nd has only one number in the ranges defined by previous draw 2010/28 Sun 1st. It is number 47 highlighted with blue color in the table above.
Draw 2010/28 Wed 2nd has three such numbers. Number 2 is in the first range 1 to 16. Number 25 is in the range 18 to 25 and the last number 40 fits into range 26 to 49. The matching numbers are highlighted with orange color in the table above.
In Range Count statistics is available in summary form and also as per-ticket property.
See also Range Patterns ticket filter.
These statistics show the count of hot numbers and the count of cold numbers in analyzed draws or tickets. Numbers are hot when they have been drawn very frequently in the last few draws, cold numbers are those which haven't been drawn at all or only once or twice in the last few draws.
The minimum count of hits of hot numbers and the maximum allowed hits of cold numbers are adjustable in application options under menu Tools - Options - Number Coloring - Hot/Cold.
If you analyze the whole winning numbers database of Expert Lotto 6/49 Demo lottery you will find out that winning numbers very frequently contain 0 to 2 cold numbers from previous draws. There are also very often 0 to 2 hot numbers in any past draw.
Note: the example above applies to Hot/Cold options set to Maximum frequency of cold numbers: 1, Minimum frequency of hot numbers: 4, Scan for hot/cold numbers in 20 latest draws.
These statistics are available in summary form and also as per-ticket properties.
See also Hot/Cold Numbers filter and Hot/Cold Numbers coloring.
Shows the distribution of ticket numbers into a matrix of all pool numbers. There are four ways to arrange pool numbers into a matrix. Each row of such matrix represents one group of numbers. The statistics show the distribution of analyzed ticket numbers into the groups.
The examples below are given for Expert Lotto 6/49 demo lottery which has the latest drawn numbers 23-29-36-42-44-47-[7].
This matrix has five columns, the numbers are arranged from the top to the bottom. The count of rows depends on the pool size.
1 |
11 |
21 |
31 |
41 |
2 |
12 |
22 |
32 |
42 |
3 |
13 |
23 |
33 |
43 |
4 |
14 |
24 |
34 |
44 |
5 |
15 |
25 |
35 |
45 |
6 |
16 |
26 |
36 |
46 |
7 |
17 |
27 |
37 |
47 |
8 |
18 |
28 |
38 |
48 |
9 |
19 |
29 |
39 |
49 |
10 |
20 |
30 |
40 |
Each ticket number is on a separate table row so the 5 Vertical matrix distribution for the latest winning numbers is 1-1-1-1-1-1
This matrix has five columns, the numbers are arranged from left to the right. The count of rows depends on the pool size.
| 1 | 2 | 3 | 4 | 5 |
| 6 | 7 | 8 | 9 | 10 |
| 11 | 12 | 13 | 14 | 15 |
| 16 | 17 | 18 | 19 | 20 |
| 21 | 22 | 23 | 24 | 25 |
| 26 | 27 | 28 | 29 | 30 |
| 31 | 32 | 33 | 34 | 35 |
| 36 | 37 | 38 | 39 | 40 |
| 41 | 42 | 43 | 44 | 45 |
| 46 | 47 | 48 | 49 |
Two ticket numbers are on the same row so the 5 Horizontal matrix distribution is 2-1-1-1-1.
This matrix has 9 columns, the numbers are arranged from the top to the bottom. The count of rows depends on the pool size.
1 |
7 |
13 |
19 |
25 |
31 |
37 |
43 |
49 |
2 |
8 |
14 |
20 |
26 |
32 |
38 |
44 |
|
3 |
9 |
15 |
21 |
27 |
33 |
39 |
45 |
|
4 |
10 |
16 |
22 |
28 |
34 |
40 |
46 |
|
5 |
11 |
17 |
23 |
29 |
35 |
41 |
47 |
|
6 |
12 |
18 |
24 |
30 |
36 |
42 |
48 |
Three analyzed numbers are on the same row (23,29 and 47), two numbers are on another row and a single number 44 is on another row. The 9 Vertical matrix distribution value is then 3-2-1.
This matrix has 9 columns, the numbers are arranged from the left to the right. The count of rows depends on the pool size.
1 |
2 |
3 |
4 |
5 |
6 |
7 |
8 |
9 |
10 |
11 |
12 |
13 |
14 |
15 |
16 |
17 |
18 |
19 |
20 |
21 |
22 |
23 |
24 |
25 |
26 |
27 |
28 |
29 |
30 |
31 |
32 |
33 |
34 |
35 |
36 |
37 |
38 |
39 |
40 |
41 |
42 |
43 |
44 |
45 |
46 |
47 |
48 |
49 |
Two numbers are on separate rows (23 and 47), the rest of the numbers are evenly distributed into two rows. So the 9 Horizontal matrix distribution value is 2-2-1-1.
This matrix has 10 columns, the numbers are arranged from the top to the bottom. The count of rows depends on the pool size.
1 |
6 |
11 |
16 |
21 |
26 |
31 |
36 |
41 |
46 |
2 |
7 |
12 |
17 |
22 |
27 |
32 |
37 |
42 |
47 |
3 |
8 |
13 |
18 |
23 |
28 |
33 |
38 |
43 |
48 |
4 |
9 |
14 |
19 |
24 |
29 |
34 |
39 |
44 |
49 |
5 |
10 |
15 |
20 |
25 |
30 |
35 |
40 |
45 |
Two analyzed numbers are on the same row (42 and 47), two numbers are on another row (29 and 44) and two remaining numbers are each on another row. The 10 Vertical matrix distribution value is then 2-2-1-1.
This matrix has 10 columns, the numbers are arranged from the left to the right. The count of rows depends on the pool size.
1 |
2 |
3 |
4 |
5 |
6 |
7 |
8 |
9 |
10 |
11 |
12 |
13 |
14 |
15 |
16 |
17 |
18 |
19 |
20 |
21 |
22 |
23 |
24 |
25 |
26 |
27 |
28 |
29 |
30 |
31 |
32 |
33 |
34 |
35 |
36 |
37 |
38 |
39 |
40 |
41 |
42 |
43 |
44 |
45 |
46 |
47 |
48 |
49 |
Three numbers are on the same row (42, 44 and 47), two numbers are on a different row (23 and 29) and a single number is on another row. So the 10 Horizontal matrix distribution value is 3-2-1.
All these statistics are available in summary form and also as per-ticket properties.
These statistics show the occurrences of all possible number pairs in analyzed tickets. In a x/49 lottery the pairs are 1-2, 1-3, 1-4 and so on up to 47-48 and 48-49.
For example in Expert Lotto 6/49 Demo Lottery the 10 latest draws are:
| 2010/28 Sun 2nd | 23 | 29 | 36 | 42 | 44 | 47 | [07] |
| 2010/28 Sun 1st | 06 | 13 | 14 | 19 | 41 | 42 | [29] |
| 2010/28 Wed 2nd | 02 | 13 | 16 | 17 | 25 | 40 | [27] |
| 2010/28 Wed 1st | 16 | 18 | 22 | 23 | 28 | 29 | [24] |
| 2010/27 Sun 2nd | 01 | 06 | 12 | 24 | 32 | 41 | [44] |
| 2010/27 Sun 1st | 02 | 15 | 22 | 29 | 30 | 37 | [42] |
| 2010/27 Wed 2nd | 20 | 23 | 25 | 30 | 33 | 35 | [07] |
| 2010/27 Wed 1st | 08 | 11 | 19 | 26 | 48 | 49 | [18] |
| 2010/26 Sun 2nd | 08 | 11 | 18 | 32 | 36 | 38 | [06] |
| 2010/26 Sun 1st | 05 | 06 | 11 | 31 | 40 | 43 | [32] |
Pairs analysis shows that the draws don't contain pair 1-2. Also pairs
1-3, 1-4 and 1-5 are not found in analyzed tickets. Pair 1-6 occurs
just once (see cells with blue background in the table above).
For example pair 22-29 has been found twice in the analyzed tickets
(see cells with orange background) so the analyzer table shows
Occurrence value of 2 in the corresponding table row.
See also Consecutive Pairs statistics.
These statistics show the occurrences of all possible number triplets in analyzed tickets. In a x/49 the triplets are 1-2-3, 1-2-4, 1-2-5 and so on up to 46-48-49 and 47-48-49.
See also Consecutive Triplets statistics.
These statistics show the occurrences of all possible number quads in analyzed tickets. In a x/49 the quads are 1-2-3-4, 1-2-3-5, 1-2-3-6 and so on up to 45-47-48-49 and 46-47-48-49.
Note: These statistics are available only in lotteries which draw five or more numbers.
See also Consecutive Quads statistics.
These statistics show the occurrences of all possible number pentads in analyzed tickets. In a x/49 lottery the pentads are 1-2-3-4-5, 1-2-3-4-6, 1-2-3-4-7 and so on up to 44-46-47-48-49 and 45-46-47-48-49.
Note: These statistics are available only in lotteries which draw six or more numbers.
See also Consecutive Pentads statistics.
This analyzer lists all possible combinations of three numbers and counts occurrences of any of two numbers from the threer. For example the analysis of the latest draw in Expert Lotto 6/49 Demo lottery shows one occurrence of combination 1-2-12. The ticket numbers in the latest draw are 2-12-13-27-29-31 [7]. So we can see that two numbers of those three are present in the analyzed ticket: 2-12.
Note: This analyzer is not available for Pick-N lotteries.
See also Three if Four statistics.
This analyzer lists all possible combinations of four numbers and counts occurrences of any of three numbers from the four. For example the analysis of the latest draw in Expert Lotto 6/49 Demo lottery shows one occurrence of combination 1-2-12-13. The ticket numbers in the latest draw are 2-12-13-27-29-31 [7]. So we can see that three numbers of those four are present in the analyzed ticket: 2-12-13.
Note: This analyzer is not available for Pick-N lotteries.
See also Two if Three statistics.
The statistics show the occurrences of combinations of six and more numbers. The statistics are available only for lotteries that draw 7 and more numbers.
Note: The statistics are not available if there are too many possible combinations. For example in a x/80 Keno lottery there are over 300 millions of possible combinations of six numbers. It is possible to override this limit by starting Expert Lotto with -J-Dstats.combo.nolimit=true command line switch. However in that case the application may refuse to calculate the statistics if there is not enough free RAM memory.
See also Pairs, Triplets, Quads and Pentads statistics.
Consecutive numbers are numbers where each number is one higher than the previous one. For example 1-2 or 30-31-32 etc. Consecutive Summary statistics show how many combinations of consecutive numbers each analyzed ticket/draw has.
For example the latest 10 draws in Expert Lotto 6/49 Demo Lottery are:
| 2010/28 Sun 2nd | 23 | 29 | 36 | 42 | 44 | 47 | [07] |
| 2010/28 Sun 1st | 06 | 13 | 14 | 19 | 41 | 42 | [29] |
| 2010/28 Wed 2nd | 02 | 13 | 16 | 17 | 25 | 40 | [27] |
| 2010/28 Wed 1st | 16 | 18 | 22 | 23 | 28 | 29 | [24] |
| 2010/27 Sun 2nd | 01 | 06 | 12 | 24 | 32 | 41 | [44] |
| 2010/27 Sun 1st | 02 | 15 | 22 | 29 | 30 | 37 | [42] |
| 2010/27 Wed 2nd | 20 | 23 | 25 | 30 | 33 | 35 | [07] |
| 2010/27 Wed 1st | 08 | 11 | 19 | 26 | 48 | 49 | [18] |
| 2010/26 Sun 2nd | 08 | 11 | 18 | 32 | 36 | 38 | [06] |
| 2010/26 Sun 1st | 05 | 06 | 11 | 31 | 40 | 43 | [32] |
The analyzer table of consecutive pairs shows that two pairs of consecutive numbers were found in two analyzed draws (2010/28 Sun 1st and 2010/28 Wed 1st). One pair of consecutive numbers was found in four draws (blue background in the table above) and four draws have no pair of consecutive numbers.
None of the 10 latest draws has any triplet of consecutive numbers, any quad or pentad of consecutive numbers.
Note: Ticket with numbers e.g. 10-15-16-17-18-20 is always evaluated as one quad of consecutive numbers (15-16-17-18). It never shows in the statistics of consecutive pairs as having two pairs of consecutive numbers (15-16 and 17-18). The same applies for tickets containing triplets or pentads of consecutive numbers.
See also Consecutive Numbers ticket filter and Consecutive Number Combinations statistics.
Consecutive numbers are numbers where each number is one higher than the previous one.
These statistics show the occurrences of combinations of consecutive numbers in analyzed ticket/draw.
Note: Ticket with numbers e.g. 10-15-16-17-18-20 is always evaluated as a single occurrence of a quad of consecutive numbers (15-16-17-18). It never shows in the statistics of consecutive pairs as an occurrence of pair 15-16 and an occurrence of pair 17-18. The same applies for tickets containing triplets or pentads of consecutive numbers.
See also Consecutive Pairs, Consecutive Triplets and Consecutive Quads ticket filters.
See also Consecutive Summary statistics.
Number Announcers show which numbers hit most frequently in the next draw after numbers - announcers - from the latest draw. The statistics always apply to the latest draw in the selection of past winning numbers that have been selected for analysis.
The summary statistics show numbers hitting in the next draw when any of the numbers of the latest draw were drawn. The positional statistics show numbers hitting in the next draw at a given ticket position when a given announcer was drawn at the same position as in the latest draw.
For example in Expert Lotto 6/49 Demo Lottery the 10 latest draws are:
| 2010/28 Sun 2nd | 23 | 29 | 36 | 42 | 44 | 47 | [07] |
| 2010/28 Sun 1st | 06 | 13 | 14 | 19 | 41 | 42 | [29] |
| 2010/28 Wed 2nd | 02 | 13 | 16 | 17 | 25 | 40 | [27] |
| 2010/28 Wed 1st | 16 | 18 | 22 | 23 | 28 | 29 | [24] |
| 2010/27 Sun 2nd | 01 | 06 | 12 | 24 | 32 | 41 | [44] |
| 2010/27 Sun 1st | 02 | 15 | 22 | 29 | 30 | 37 | [42] |
| 2010/27 Wed 2nd | 20 | 23 | 25 | 30 | 33 | 35 | [07] |
| 2010/27 Wed 1st | 08 | 11 | 19 | 26 | 48 | 49 | [18] |
| 2010/26 Sun 2nd | 08 | 11 | 18 | 32 | 36 | 38 | [06] |
| 2010/26 Sun 1st | 05 | 06 | 11 | 31 | 40 | 43 | [32] |
The latest draw in the selection above is 2010/28 Sun 2nd so the announcing numbers are 23-29-36-42-44-47-[7]. The announcers are shown in bold font in the table above.
The summary table in Number Announcers statistics of the 10 latest draws shows that number 2 hits most frequently after any of the announcing numbers. Number two hit in draw 2010/27 Sun 1st where it was announced by number 23 from the previous draw. See the cells with blue background in the table above. Number two also hit in draw 2010/28 Wed 2nd where it was announced by number 23 and number 29 from the previous draw. Hence the summary table shows Occurrence value of 3 for number 2.
When Number Announcers statistics is calculated for the whole lottery database then the announcing numbers are again 23, 29, 36, 42, 44 and 47. The summary statistics then for example show that number 9 followed one of the announcing numbers in the next draw most frequently when one of the announcers was drawn. It was 'announced' 112 times in the whole lottery history. On the other hand number 26 was the least frequent number in the next draw when one of the announcers was drawn, it was announced only 61 times.
The same analysis for ticket position e.g. 5 shows that numbers 34, 35 and 38 hit in the next draw at ticket position 5 most frequently (four times) when announcing number 44 was drawn at ticket position 5 in the latest draw. Statistics for ticket position 1 where the announcing number is 23 shows that only numbers 1, 8 and 17 hit in the next draw on the same first ticket position.
Note: These statistics are available only when analyzing past winning numbers draws.
See also Bonus Number Announcers, Pair Announcers and Triplet Announcers.
Bonus Number Announcers show which bonus numbers hit most frequently in the next draw after bonus numbers - announcers - from the latest draw. The statistics always apply to the latest draw in the selection of past winning numbers that have been selected for analysis.
The summary statistics show bonus numbers hitting in the next draw when the bonus numbers of the latest draw was drawn.
See also Number Announcers.
Pair Announcers statistics is very similar to Number Announcers. Except that Pair Announcers track which numbers follow most frequently in the next draw when the previous draw contains at least one pair of numbers (announcing pair) from the latest draw.
For example in Expert Lotto 6/49 Demo Lottery the 10 latest draws are:
| 2010/28 Sun 2nd | 23 | 29 | 36 | 42 | 44 | 47 | [07] |
| 2010/28 Sun 1st | 06 | 13 | 14 | 19 | 41 | 42 | [29] |
| 2010/28 Wed 2nd | 02 | 13 | 16 | 17 | 25 | 40 | [27] |
| 2010/28 Wed 1st | 16 | 18 | 22 | 23 | 28 | 29 | [24] |
| 2010/27 Sun 2nd | 01 | 06 | 12 | 24 | 32 | 41 | [44] |
| 2010/27 Sun 1st | 02 | 15 | 22 | 29 | 30 | 37 | [42] |
| 2010/27 Wed 2nd | 20 | 23 | 25 | 30 | 33 | 35 | [07] |
| 2010/27 Wed 1st | 08 | 11 | 19 | 26 | 48 | 49 | [18] |
| 2010/26 Sun 2nd | 08 | 11 | 18 | 32 | 36 | 38 | [06] |
| 2010/26 Sun 1st | 05 | 06 | 11 | 31 | 40 | 43 | [32] |
The latest draw in the selection above is 2010/28 Sun 2nd with winning numbers are 23-29-36-42-44-47-[7]. So the announcing pairs are 23-29, 23-36, 23-42, 23-44, 23-47, 29-36 and so on up to the last pair 44-47. Only one of the latest 10 draws contain an announcing pair - draw 2010/28 Wed 1st (see numbers in bold in the table above). The numbers following this announcing pair are 2, 13, 16, 17, 25, 40. Therefore the analyzer table shows occurrence value of 1 for these numbers.
Analysis of the whole lottery database shows that if one of the pairs 23-29 to 44-47 is drawn then most frequently following numbers are 36 and 46. The numbers were announced 32 times. On the other hand, numbers 32 and 33 are the least frequent as they were announced only 12 times by one of the pairs of latest winning numbers.
See also Number Announcers and Triplet Announcers.
Triplet Announcers statistics is the same as Pair Announcers except that it tracks which numbers follow most frequently in the next draw when the previous draw contains at least one triplet of numbers (announcing triplet) from the latest draw.
For example in Expert Lotto 6/49 Demo Lottery the 10 latest draws are:
| 2010/28 Sun 2nd | 23 | 29 | 36 | 42 | 44 | 47 | [07] |
| 2010/28 Sun 1st | 06 | 13 | 14 | 19 | 41 | 42 | [29] |
| 2010/28 Wed 2nd | 02 | 13 | 16 | 17 | 25 | 40 | [27] |
| 2010/28 Wed 1st | 16 | 18 | 22 | 23 | 28 | 29 | [24] |
| 2010/27 Sun 2nd | 01 | 06 | 12 | 24 | 32 | 41 | [44] |
| 2010/27 Sun 1st | 02 | 15 | 22 | 29 | 30 | 37 | [42] |
| 2010/27 Wed 2nd | 20 | 23 | 25 | 30 | 33 | 35 | [07] |
| 2010/27 Wed 1st | 08 | 11 | 19 | 26 | 48 | 49 | [18] |
| 2010/26 Sun 2nd | 08 | 11 | 18 | 32 | 36 | 38 | [06] |
| 2010/26 Sun 1st | 05 | 06 | 11 | 31 | 40 | 43 | [32] |
The latest draw in the selection above is 2010/28 Sun 2nd with winning numbers are 23-29-36-42-44-47-[7]. So the announcing triplets are 23-29-36, 23-29-42 and so on up to the last triplet 42-44-47. There is no such triplet in the latest 10 draws so the analyzer table shows zero occurrence for all pool numbers.
Analysis of the whole lottery database shows that if one of the triplets 23-29-36 to 42-44-47 is drawn then most frequently following number is 6, which has been announced 6 times. On the other hand, numbers 2, 24, 32 and 33 never hit in the next draw when one of the announcing triplets was drawn in the previous draw.
See also Number Announcers and Pair Announcers.
Negative and Positive History Differences statistics track how many analyzed draws/tickets produce negative and positive History sum differences in a given Level. The analyzer shows collected data in three ways - discrete values, values grouped by range of 5 and values grouped by range of 10.
For example 10 latest draws in Expert Lotto 6/49 Demo Lottery produce the following History sum differences in Level 0:
| 2010/28 Sun 2nd | +13 |
| 2010/28 Sun 1st | -3 |
| 2010/28 Wed 2nd | -13 |
| 2010/28 Wed 1st | +18 |
| 2010/27 Sun 2nd | -1 |
| 2010/27 Sun 1st | -9 |
| 2010/27 Wed 2nd | +6 |
| 2010/27 Wed 1st | +15 |
| 2010/26 Sun 2nd | +13 |
| 2010/26 Sun 1st | +22 |
Positive History Differences analysis shows that the most frequent positive difference is +13 which occurs in two analyzed draws. The same analysis grouped by range of 5 shows that no analyzed draw has positive difference in the range of 0 to 5, there's one draw with the difference in the range of 6 to 10 (2010/27 Wed 2nd), three draws with the difference in the range of 11 to 15 etc. The same analysis grouped by range of 10 shows that the most frequent range of positive history differences is 11 to 20 as there are four such analyzed draws.
Negative History Differences analysis shows that there are four
different negative values (-3, -13, -1 and - 9). When the analysis
results are grouped by range of 5 then the most frequent negative
history difference range is 1 to 5 as there are two such draws (2010/28
Sun 1st and 2010/27 Sun 2nd). Results grouped by range of 10 show that
the range 1 to 10 was found in three analyzed draws.
These statistics track the occurrences of History segment combinations in analyzed draws/tickets.
For example 10 latest draws in Expert Lotto 6/49 Demo Lottery produce the following segment combinations in Level 0:
| 2010/28 Sun 2nd | n/a |
| 2010/28 Sun 1st | 3-3-0 |
| 2010/28 Wed 2nd | 4-0-2 |
| 2010/28 Wed 1st | 3-1-2 |
| 2010/27 Sun 2nd | 4-2-0 |
| 2010/27 Sun 1st | 2-3-1 |
| 2010/27 Wed 2nd | 1-4-1 |
| 2010/27 Wed 1st | 4-1-1 |
| 2010/26 Sun 2nd | 3-3-0 |
| 2010/26 Sun 1st | 3-3-0 |
See Segmentation tab in Summary History window for segment combinations at other Levels.
Segment Combinations analysis of Level 0 for 10 latest draws then shows that the most frequent segment combination is 3-3-0. It hit three times in the analyzed draws and its latest occurrence was just two draws ago. Other segment combinations hit just once and many segment combination haven't been found at all in the analyzed draws, e.g. 6-0-0 or 0-0-6. So the Occurrence column shows value of 0 in corresponding table rows.
These statistics track the count of unique History Sum differences in analyzed tickets. A sum difference is unique if it appears in a single Level only.
For example the History differences for the latest draw in Expert Lotto 6/49 Demo Lottery are: +13, -14, -27, +17, +3, +8, +12, -5, +23, +11, +31 in Levels 0 to 10. None of the values repeat in any other Level so there are 11 unique sum differences for this draw. The analysis of 10 latest draws in that lottery then shows that the most frequent count of unique sum differences is 10 as it was found in five out of ten analyzed draw.
The count of unique sum differences for a single draw is also available in Summary History window under Sums tab in Unique Differences column.
See also Unique Sum Differences filter.
These statistics track how many numbers from analyzed draws/tickets have unique History number difference value in a given Level. A ticket number has unique History difference if it appears alone on a row Segmentation table for given Level.
For example the winning numbers of the latest draw in Expert Lotto
6/49 Demo Lottery look like this in Segmentation table for Level 0 of
previous draw:
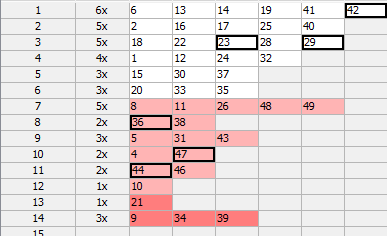
Numbers 23 and 29 have the same History difference of 3 so there are only 5 numbers with unique History number difference value in that draw.
Summary analysis of Unique Number Differences of 10 latest draws in that lottery then shows that the most frequent count of numbers with unique differences is 5 numbers as it was found in five of the analyzed draws.
See also Unique Number Differences filter.
These statistics are available in summary form and also as per-ticket properties.
These statistics track the count of pool numbers in History segments generated by analyzed tickets/draws. To count pool numbers in History segments for past winning numbers draws, open Summary History window, switch e.g. to Sums tab and toggle Details button. The lower part of Summary History window will show Number History and Segmentation details for selected draw. Switch to Segmentation details and the table will show numbers from the first segment with white background. Numbers from the second background have pink background and numbers from the last segment have red background.
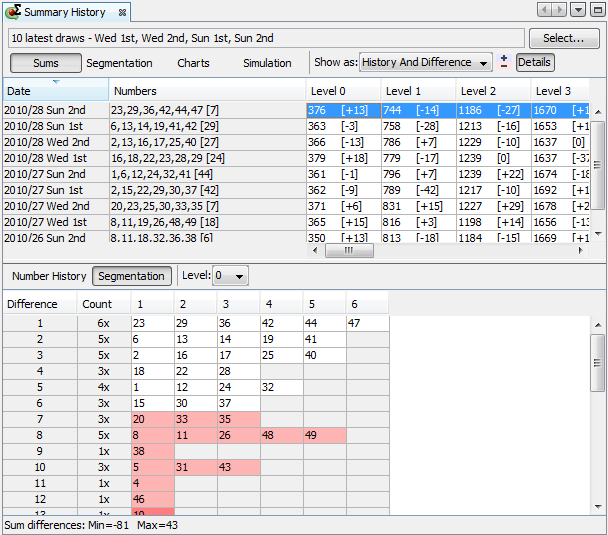
The example above shows that the latest draw in Expert Lotto 6/49 Demo Lottery has 26 numbers in Segment 1 (there are 26 numbers with white background) and 14 numbers in Segment 2 (numbers with pink background) and 9 numbers from Segment 3. Segment Size analysis of 10 latest draws in that lottery then for example shows that the most common size of Segment 1 in Level 0 is 26 numbers.
The statistics show how many levels have the same segment size as 1, 2, 3 or 4 previous draws.
For example ten latest draws in the demo Expert Lotto 6/49 lottery produce the following segment sizes in Level 2:
| Draw | Segment Size 2 |
|---|---|
| 2010/26 Sun 1st |
27-13-9 |
| 2010/26 Sun 2nd |
25-15-9 |
| 2010/27 Wed 1st |
26-14-9 |
| 2010/27 Wed 2nd |
24-15-10 |
| 2010/27 Sun 1st |
24-15-10 |
| 2010/27 Sun 2nd |
23-15-11 |
| 2010/28 Wed 1st |
23-15-11 |
| 2010/28 Wed 2nd | 24-15-10 |
| 2010/28 Sun 1st | 22-17-10 |
| 2010/28 Sun 2nd | 25-13-11 |
From the table above we can see that the size 23 of segment 1 in draw 2010/28 Wed 1st repeats from the previous draw 2010/27 Sun 2nd.
The size 15 of segment 2 in draw 2010/28 Wed 2nd repeats in four previous draws - from 2010/28 Wed 1st to 2010/27 Wed 2nd. So when analyzing Segment Size Repeats of the latest 10 draw in the demo lottery the table for Segment 2, Repeats 4 will show Occurrence 1 for row labeled "1". It means there is just one level (2) that has the size of segment 2 repeated in four previous draws.
See also Segment Size statistics.
This summary statistics shows the frequency of History differences of winning numbers in analyzed draws or tickets.
If we analyze all past draws in Expert Lotto 6/49 Demo lottery we will see that the most frequent History Number Difference in Level 0 is 1. It has been found in 750 analyzed past draws. Its latest occurrence is in the very latest draw (2010/28 Sun 2nd, winning number 42).
On the other hand History Number Difference 46 haven't hit yet.
You can also note that History Number Difference of value 1 is the most frequent one in all History Levels. It is because at least one winning number is very often repeated from the previous draw.
See also History Number Differences filter.
Shows the sum of History differences of the winning numbers of analyzed draw or ticket. The statistics are available for each History level and there is also the total sum across all levels.
The latest winning numbers in Expert Lotto 6/49 Demo lottery are 23-29-36-42-44-47-[7] (draw 2010/28 Sun 2nd). To find their History differences we must click menu History - Summary History, make sure Sums table is showing and then highlight preceding draw, i.e. draw 2010/28 Sun 1st. Then toggle Details button to show Number History details for that draw in the lower part of the Summary History window. We can see that the winning numbers of the latest draw are highlighted with a black border. The number differences of the latest draw in Level 0 are:
| Winning Number | Number Difference in Level 0 |
| 23 | 3 |
| 29 | 3 |
| 36 | 8 |
| 42 | 1 |
| 44 | 11 |
| 47 | 10 |
| Sum: | 36 |
The sum of all Number differences in Level 0 is 36 so the statistical property will be showing value 36 in column Number Differences Sum 0.
These statistics are available in summary form and also as per-ticket properties.
See also Number Differences Sum filter.
This statistics is similar to Number Differences Sum statistics except that it divides all the possible sum values into several ranges.
The values are divided into chunks of ten (1-10, 11-20, 21-30, etc), chunks of 30 (1-30, 31-60, 61-90, etc) and chunks of 50 (1-50, 51-100, 101-150, etc).
See also Number Differences Sum filter and Number Differences Sum statistics.
This statistics show how many History Differences fit into +/-10 range.
For example the latest two draws in Expert Lotto 6/49 Demo lottery have the following History differences:
| Level 0 | Level 1 | Level 2 | Level 3 | Level 4 | Level 5 | Level 6 | Level 7 | Level 8 | Level 9 | Level 10 | ||||||||
| 2010/28 Sun 2nd | 23 | 29 | 36 | 42 | 44 | 47 | [07] | +13 | -14 | -27 | +17 | +3 | +8 | +12 | -5 | +23 | +11 | +31 |
| 2010/28 Sun 1st | 06 | 13 | 14 | 19 | 41 | 42 | [29] | -3 | -28 | -16 | +16 | -35 | -7 | +9 | +7 | +25 | +16 | +21 |
You can see that in the latest draw 2010/28 Sun 2nd there are three Levels where the History difference is in the range of -10 to +10 (highlighted with blue background). In previous draw 2010/28 Sun 1st there are four such Levels (highlighted with green background).
If you analyze the whole winning numbers database of the Expert Lotto 6/49 Demo lottery you will find out that very frequently there are 4 to 5 Levels where the History differences are in the range -10 to +10.
![]() The range values are adjustable in application options under menu Tools - Options - History - Ranges. The default values are -10 to +10.
The range values are adjustable in application options under menu Tools - Options - History - Ranges. The default values are -10 to +10.
These statistics are available in summary form and also as per-ticket properties.
See also Sums History ticket filter - condition The difference in X to Y levels is at most A to B - and Difference Ranges statistics.
Shows whether the History sum value in a given draw and in given Level is greater or lower than the History sum value in previous draw. A plus sign (+) means the History sum is greater than the previous value, a minus sign (-) means the sum is lower. An equals sign (=) means the History sum is the same as in previous draw.
These statistics are available in summary form and also as per-ticket properties.
See also History Sum Movement filter and History Diff Movement statistics.
Shows whether the History difference value in a given draw and in given Level is greater or lower than the History difference value in previous draw. A plus sign (+) means the History difference is greater than the previous value, a minus sign (-) means the difference is lower. An equals sign (=) means the History difference is the same as in previous draw.
These statistics are available in summary form and also as per-ticket properties.
See also History Difference Movement filter and History Sum Movement statistics.
The statistics show the maximum count of consecutive History Levels that have either only negative or only positive History differences.
For example that latest draw 2010/28 Sun 2nd in the demo Expert Lotto 6/49 lottery has the following History difference values:
| Level | Diff |
|---|---|
| 0 | 13 |
| 1 | -14 |
| 2 | -27 |
| 3 | 17 |
| 4 | 3 |
| 5 | 8 |
| 6 | 12 |
| 7 | -5 |
| 8 | 23 |
| 10 | 11 |
| 11 | 31 |
You can see that the longest section of the table above that has only negative differences is between Levels 1 and 2 (orange background). So the Consecutive Neg Diffs for draw 2010/28 Sun 2nd is 2.
The longest section of the table that has only positive differences is between Levels 3 and 6 (blue background). So the Consecutive Pos Diffs for draw 2010/28 Sun 2nd is 4.
These statistics are available in summary form and also as per-ticket properties.
Shows the sum of History differences of the winning numbers of analyzed draw or ticket. The statistics are available for each History level and there is also the total sum across all levels.
The latest winning numbers in Expert Lotto 6/49 Demo lottery are 23-29-36-42-44-47-[7] (draw 2010/28 Sun 2nd). To find their History differences we must click menu History - Summary History, make sure Sums table is showing and then highlight preceding draw, i.e. draw 2010/28 Sun 1st. Then toggle Details button to show Number History details for that draw in the lower part of the Summary History window. We can see that the winning numbers of the latest draw are highlighted with a black border. The number differences of the latest draw in Level 0 are:
| Winning Number | Number Difference in Level 0 |
| 23 | 3 |
| 29 | 3 |
| 36 | 8 |
| 42 | 1 |
| 44 | 11 |
| 47 | 10 |
| Sum: | 36 |
The sum of all Number differences in Level 0 is 36 so the statistical property will be showing value 36 in column Number Differences Sum 0.
These statistics are available in summary form and also as per-ticket properties.
See also Number Differences Sum filter.
The statistics show how many History differences repeat in the same Level from previous draws. The statistics are given for repeats from a single previous draw and for repeats from 5, 10, 15, 30 and 50 previous draws.
For example draw 2010/27 Sun 1st in the demo Expert Lotto 6/49 lottery has two History differences repeated from the previous five draws. The History difference 14 in Level 3 repeats from draw 2010/26 Sun 2nd and History difference 6 in Level 6 repeats from the previous draw 2010/27 Wed 2nd.
These statistics are available in summary form and also as per-ticket properties.
The statistics show whether a History difference in a given Level is in pre-defined of -10 to +10, above that range or below that range. The value range is adjustable in application options under menu Tools - Options - History - Ranges. The default values are -10 to +10.
Value "in range" means that the History difference value is in pre-defined range. Value ">" means the difference is above the pre-defined range, value "<" means the differences is below the pre-defined range.
These statistics are available in summary form and also as per-ticket properties.
See also In Range Differences statistics.
The winning numbers of each draw define various properties that can be tracked and evaluated from the statistical point of view. The statistical properties are based either solely on winning numbers of a given draw, for example the ratio of odd and even numbers or the sum of all winning numbers, or the statistical properties may relate to other winning numbers draws, for example how many numbers repeat from previous draw(s).
Most of the statistical properties have corresponding ticket filter which allows removing tickets that do (not) have the desired properties. You can see the statistical properties of past draws in a table using menu Winning Numbers - Show As - Properties.
Some statistical properties are available in charts where you can see the progression of the property over the selected past draws. It is usually more convenient and easier to estimate the statistical properties for the coming draws using these charts. Click menu Winning Numbers - Show As - Charts to open the charts window.
To see statistical properties of tickets in the Package, click menu Package - Show As - Properties.
You can also use menu Tools - Ticket Properties to open Ticket Properties window which displays the statistical properties of a ticket/draw selected in currently active window. Just click a ticket/draw in any of the following windows to see the statistical properties of that ticket/draw in Ticket Properties window:
See also Summary Statistics.
These statistics track the occurrences of odd and even numbers in analyzed tickets.
These statistics are available in summary form and also as per-ticket properties.
See also Odd/Even ticket filter.
These statistics track the occurrences of low and high numbers in analyzed tickets.
Number is low when it is in the lower
half of number pool, number is high when it is in the upper half of
number pool.
For example in a x/40 lottery, numbers 1 to 20 are low, numbers 21
to 40 are high numbers. In a x/49 lottery, numbers 1 to 24 are low,
numbers 25 to 49 are high.
These statistics are available in summary form and also as per-ticket properties.
See also Low/High ticket filter.
Ticket sum statistics track the occurrence of the sum main numbers in analyzed tickets. For example the winning numbers in the latest draw of Expert Lotto 6/49 Demo Lottery are 23-29-36-42-44-47-[07]. So the sum value for that draw is 23+29+36+42+44+47=221.
Sum root is a single digit number ranging from 1 to 9. It is calculated from arithmetic sum of ticket's main numbers by repeatedly summing the digits of the sum value until only a single digit number is left. For example the sum of ticket 11-22-32-35-46-48 is 194. So the Sum Root value is 1+9+4=14 -> 1+4=5.
If you analyze the whole list of all possible number combinations you will see that the Sum Root statistics divides the analyzed tickets into nine evenly-sized groups.
This is sum of odd or even numbers of the analyzed ticket. For example the winning numbers in the latest draw of Expert Lotto 6/49 Demo Lottery are 23-29-36-42-44-47-[07]. So the sum of odd numbers is 23+29 +47=99. Sum of even numbers is 36 + 42 + 44 = 122.
This is sum of low or high numbers of the analyzed ticket. For example the winning numbers in the latest draw of Expert Lotto 6/49 Demo Lottery are 23-29-36-42-44-47-[07]. So the sum of low numbers is 23 because that is the only low number in that draw. Sum of high numbers is 29 + 36 + 42 + 44 + 47 = 198.
This is sum root of ticket's odd or even numbers. For example the winning numbers in the latest draw of Expert Lotto 6/49 Demo Lottery are 23-29-36-42-44-47-[07]. Sum of even numbers is 36 + 42 + 44 = 122. The root of that sum is 1+2+2=5.
This is sum root of ticket's low or high numbers. For example the winning numbers in the latest draw of Expert Lotto 6/49 Demo Lottery are 23-29-36-42-44-47-[07]. So the sum of low numbers is 23 because that is the only low number in that draw. The root of that sum is 2+3=5. Sum of high numbers is 29 + 36 + 42 + 44 + 47 = 198. And the root of that sum is 1+9+8=18 -> 1+8=9.
This is the least significant (last) digit of the value of the sum of analyzed ticket numbers. So if the sum of winning numbers of the latest draw in Expert Lotto 6/49 Demo lottery is 221 (see above), then its last digit is 1. Similar to Sum Root this statistics divides the full set of all possible number combinations into ten evenly sized groups.
This is the sum of all first digits of the analyzed ticket. For example the winning numbers in the latest draw of Expert Lotto 6/49 Demo Lottery are 23-29-36-42-44-47-[07]. So the first digits are 2, 2, 3, 4, 4, 4 and their sum is 19.
This is the sum of all last digits of the analyzed ticket. For example the winning numbers in the latest draw of Expert Lotto 6/49 Demo Lottery are 23-29-36-42-44-47-[07]. So the last digits are 3, 9, 6, 2, 4, 7 and their sum is 31.
This is the sum of all first and last digits of the analyzed ticket. For example the winning numbers in the latest draw of Expert Lotto 6/49 Demo Lottery are 23-29-36-42-44-47-[07]. The sum of the first digits is 19, the sum of last digits is 31 so the sum of all digits is 19+31=50.
This is the sum root of all first digits of the analyzed ticket. For example the winning numbers in the latest draw of Expert Lotto 6/49 Demo Lottery are 23-29-36-42-44-47-[07]. So the first digits are 2, 2, 3, 4, 4, 4 and their sum is 19 with root value of 1.
This is the sum root of all last digits of the analyzed ticket. For example the winning numbers in the latest draw of Expert Lotto 6/49 Demo Lottery are 23-29-36-42-44-47-[07]. So the last digits are 3, 9, 6, 2, 4, 7 and their sum is 31 with root value of 4.
If the lottery draws two or more bonus numbers then this is the sum of all bonus numbers. If the the lottery has just one or no bonus number then these statistics are not available.
All these statistics are available in summary form and also as per-ticket properties.
See also Sum Range, Sum Root, Sum of Odd/Even Numbers, Sum of Low/High Numbers and Sum's Last Digit ticket filters.
These statistics track how many analyzed ticket numbers repeat from previous draws. The statistics show the count numbers repeating from 1, 3, 5 and 10 previous draws.
For example the latest 10 draws in Expert Lotto 6/49 Demo Lottery are:
| 2010/28 Sun 2nd | 23 | 29 | 36 | 42 | 44 | 47 | [07] |
| 2010/28 Sun 1st | 06 | 13 | 14 | 19 | 41 | 42 | [29] |
| 2010/28 Wed 2nd | 02 | 13 | 16 | 17 | 25 | 40 | [27] |
| 2010/28 Wed 1st | 16 | 18 | 22 | 23 | 28 | 29 | [24] |
| 2010/27 Sun 2nd | 01 | 06 | 12 | 24 | 32 | 41 | [44] |
| 2010/27 Sun 1st | 02 | 15 | 22 | 29 | 30 | 37 | [42] |
| 2010/27 Wed 2nd | 20 | 23 | 25 | 30 | 33 | 35 | [07] |
| 2010/27 Wed 1st | 08 | 11 | 19 | 26 | 48 | 49 | [18] |
| 2010/26 Sun 2nd | 08 | 11 | 18 | 32 | 36 | 38 | [06] |
| 2010/26 Sun 1st | 05 | 06 | 11 | 31 | 40 | 43 | [32] |
When analyzing the latest draw 2010/28 Sun 2nd we can see that one number repeats from the previous draw. It's number 42. So the column Repeating Numbers [1] in e.g. Winning Numbers Properties window shows value of 1 for this draw.
When comparing the latest draw with three previous draws, we can see that 3 numbers repeat. Number 42 from previous draw and numbers 23 and 29 from draw 2010/28 Wed 1st (see numbers with blue background in the table above). Therefore the column Repeating Numbers [3] shows value of 3 for this draw.
Comparing the latest draw with 5 previous draws shows that only the same three numbers repeat. So column Repeating Numbers [5] also shows value of 3.
Looking at 10 previous draw we can see there are 5 repeating numbers: 42 from draw 2010/28 Sun 1st, 23 and 29 from draw 2010/28 Wed 1st, 36 from draw 2010/26 Sun 2nd and 47 from draw 2010/26 Wed 2nd. Therefore the column Repeating Numbers [10] shows value of 5 for this draw.
Note: Repeating Numbers properties of Package tickets apply to the selection of past winning numbers made in Options window.
These statistics are available in summary form and also as per-ticket properties.
See also Repeating Numbers ticket filter.
This statistical property shows the ticket index of each analyzed ticket. The ticket index corresponds to ticket's position in the list of all possible combinations. For example in a 6/49 lottery there are 13,983,816 possible combinations starting with number combination 1-2-3-4-5-6 which has ticket index 1, then number combination 1-2-3-4-5-7 which has ticket index 2, up to the last possible combination 44-45-46-47-48-49 which has ticket index 13,983,816.
For example when analyzing the latest draw in Expert Lotto 6/49 Demo Lottery with winning numbers 23-29-36-42-44-47-[7] then column Ticket Index in e.g. Winning Numbers Properties window shows value 13,737,320. So this draw is very close to the end of the list of all possible combinations.
See also Ticket Index filter and Ticket Index Movement statistics.
This statistical property shows the relative distance of analyzed ticket from the latest draw (when analyzing Package tickets) or from the previous draw (when analyzing winning numbers draws) in the full list of all possible combinations.
For example in a 6/49 lottery there are 13,983,816 possible combinations starting with number combination 1-2-3-4-5-6 which has ticket index 1, then number combination 1-2-3-4-5-7 which has ticket index 2, up to the last possible combination 44-45-46-47-48-49 which has ticket index 13,983,816.
Ticket index movement than compares the index of the latest draw (or the index of previous draw) with the index of the analyzed ticket. The lowest possible value is 0.0 which means that the analyzed ticket has the same numbers as the latest/previous draw. The highest possible value is 0.999999999. This happens only if the analyzed ticket numbers are 1-2-3-4-5-6 and the latest winning numbers are 44-45-46-47-48-49 or vice versa.
The winning numbers in the latest draw of Expert Lotto 6/49 Demo Lottery are: 23-29-36-42-44-47-[07], the corresponding ticket index is 13,737,320, the winning numbers in the previous draw are 06-13-14-19-41-42-[29] with ticket index of 7,453,915. So the ticket index movement in the latest draw is (13,737,320 - 7,453,915) / 13,983,816 = 0.45 - see Winning Numbers Properties window. That means the latest ticket index 'jumped' almost half of the whole possible range.
The ticket index of number combination 1-2-3-4-5-6 is 1. So when analyzing Package tickets the ticket index movement will show (13,737,320 - 1) / 13,983,816 = 0.98 - see Package Properties window.
Note: the ticket index movement property of Package tickets applies to the latest draw from the selection of past winning numbers made in Options window.
This statistical property is an extension of the default ticket index movement value. However in this case the index movement value can be either negative or positive. The ticket index of the latest draw in Expert Lotto 6/49 Demo Lottery is 13,737,320 so when looking at the Negative/Positive Ticket Index Movement of Package ticket 1-2-3-4-5-6 with ticket index 1 we will see negative value -0.98.
See also Ticket Index Movement ticket filter.
Ticket index is a number which uniquely identifies the ticket in the set of all possible number combinations. For example in 6/49 lottery, the ticket index 1 is equal to number combination 1-2-3-4-5-6, ticket index 2 equals to number combination 1-2-3-4-5-7, ticket index 3 is number combination 1-2-3-4-5-8 etc. Ticket numbers 44-45-46-47-48-49 have ticket index of 13,983,816.
That means there are 8 different positions. Positions of ticket index value of 1 are 0, 0, 0, 0, 0, 0, 0 and 1 and positions in ticket index 13,983,816 are 1,3,9,8,3,8,1 and 6.
The statistics then show how many times a digit 0 to 9 appears at individual ticket index positions.These statistics are available in summary form and also as per-ticket properties.
See also Ticket Index Position filter.
Adjacent numbers are numbers that are one higher or one lower than the winning numbers from the previous draw.
There are two types of Adjacent Numbers statistics. Per ticket statistics compares ticket numbers with previously drawn numbers at any ticket position. Per position statistics compares the ticket numbers at the same ticket position only.
Additional categorization is the distance between adjacent numbers. The distance ranges from 1 to 5. It means Adjacent Numbers [1] are numbers that are one higher or one lower then previous winning numbers. Adjacent Numbers [2] are numbers that are two higher or two lower then previous winning numbers. For example number 15 is adjacent [2] to numbers 13 and 17 respectively. The same applies to Adjacent Numbers [3], [4] and [5] respectively. For example number 31 is adjacent [5] to numbers 26 and 36 respectively.
For example the latest 10 draws in Expert Lotto 6/49 Demo Lottery are:
| 2010/28 Sun 2nd | 23 | 29 | 36 | 42 | 44 | 47 | [07] |
| 2010/28 Sun 1st | 06 | 13 | 14 | 19 | 41 | 42 | [29] |
| 2010/28 Wed 2nd | 02 | 13 | 16 | 17 | 25 | 40 | [27] |
| 2010/28 Wed 1st | 16 | 18 | 22 | 23 | 28 | 29 | [24] |
| 2010/27 Sun 2nd | 01 | 06 | 12 | 24 | 32 | 41 | [44] |
| 2010/27 Sun 1st | 02 | 15 | 22 | 29 | 30 | 37 | [42] |
| 2010/27 Wed 2nd | 20 | 23 | 25 | 30 | 33 | 35 | [07] |
| 2010/27 Wed 1st | 08 | 11 | 19 | 26 | 48 | 49 | [18] |
| 2010/26 Sun 2nd | 08 | 11 | 18 | 32 | 36 | 38 | [06] |
| 2010/26 Sun 1st | 05 | 06 | 11 | 31 | 40 | 43 | [32] |
In the latest draw 2010/28 Sun 2nd there is only one number adjacent
to the numbers of previous draw 2010/28 Sun 1st - number 42 is adjacent
to number 41 in the previous draw.
Draw 2010/28 Sun 1st has two
adjacent numbers - 14 and 41 which are adjacent to numbers 13 and 40 respectively.
Draw 2010/28 Wed 2nd has only one
adjacent number - 17 which is adjacent both to number 16 and to number
18 from the previous draw.
In total there are 7 cases of a single
adjacent number and three draws have two numbers adjacent to numbers
from previous draw. Adjacent numbers are highlighted with blue
background in the table above.
When looking for adjacent numbers [4], we can see that for example draw 2010/28 Wed 1st has two such numbers. Number 16 is adjacent [4] to number 12 and number 28 is adjacent [4] to number 24 from previous draw. Highlighted with red background in the table above.
| 2010/28 Sun 2nd | 23 | 29 | 36 | 42 | 44 | 47 | [07] |
| 2010/28 Sun 1st | 06 | 13 | 14 | 19 | 41 | 42 | [29] |
| 2010/28 Wed 2nd | 02 | 13 | 16 | 17 | 25 | 40 | [27] |
| 2010/28 Wed 1st | 16 | 18 | 22 | 23 | 28 | 29 | [24] |
| 2010/27 Sun 2nd | 01 | 06 | 12 | 24 | 32 | 41 | [44] |
| 2010/27 Sun 1st | 02 | 15 | 22 | 29 | 30 | 37 | [42] |
| 2010/27 Wed 2nd | 20 | 23 | 25 | 30 | 33 | 35 | [07] |
| 2010/27 Wed 1st | 08 | 11 | 19 | 26 | 48 | 49 | [18] |
| 2010/26 Sun 2nd | 08 | 11 | 18 | 32 | 36 | 38 | [06] |
| 2010/26 Sun 1st | 05 | 06 | 11 | 31 | 40 | 43 | [32] |
Blue background in the table above highlights adjacent numbers [1] when comparing by ticket position. When looking for adjacent numbers [5], we can find two such numbers in e.g. draw 2010/26 Sun 2nd. Number 11 is adjacent [5] to number 6 from previous and number 38 is adjacent to previous number 43 at the same position in previous draw. The numbers are highlighted with red background in the table above.
These statistics are available in summary form and also as per-ticket properties.
See also Adjacent Numbers filter.
Adjacent digits are first or last digits that are one higher or one lower than the appropriate digits from previous draw. Each pool number breaks down into two digits. The first digit is the leading digit of the number, the last digit is the second digit of the number. For example the first digit of number 23 is 2, the last digit of that number is 3. The first digit of number 9 is 0, the last digit of that number is 9.
There are two types of Adjacent Digits statistics. Per ticket statistics compares first/last digits with first/last digits at any position in the previous draw. Per position statistics compares the digits at the same ticket position only.
For example the latest 2 draws in Expert Lotto 6/49 Demo Lottery are:
| 2010/28 Sun 2nd | 23 | 29 | 36 | 42 | 44 | 47 | [07] |
| 2010/28 Sun 1st | 06 | 13 | 14 | 19 | 41 | 42 | [29] |
There are four last digits in draw 2010/28 Sun 2nd that are adjacent to previous draw 2010/28 Sun 1st. Last digit 3 of number 23 is adjacent to previous numbers 14 and 42 (last digitis 4 and 2). Last digit of number 42 is adjacent to previous numbers 13 and 41 (last digits 3 and 1). Last digit 4 of number 44 is adjacent to previous number 13 (last digit 3). Last digit 7 of number 47 is adjacent to number 6 (last digit 6).
When comparing the same two draws listed above per ticket positions, we can see that there no adjacent last digits. Only one first digit is adjacent to the first digits from previous draw at the same ticket position. The first digit of number 29 is 2 which is adjacent to the first digit 1 of number 13 from the previous draw at the same ticket position.
These statistics are available in summary form and also as per-ticket properties.
See also Adjacent Digits filter.
Number Movement Patterns compares the number of analyzed draw/ticket with the winning numbers of the previous draw.
For example the latest three draws in Expert Lotto 6/49 Demo lottery are:
| 2010/28 Sun 2nd | 23 | 29 | 36 | 42 | 44 | 47 | [07] |
| 2010/28 Sun 1st | 06 | 13 | 14 | 19 | 41 | 42 | [29] |
| 2010/28 Wed 2nd | 02 | 13 | 16 | 17 | 25 | 40 | [27] |
The Number Movement Pattern for draw 2010/28 Sun 2nd is ++++++ because all its winning numbers are greater than numbers at appropriate position in the previous draw.
The movement pattern for draw 2010/28 Sun 1st is +=-+++. The first winning number is 6 which is greater than number 2 at previous draw, so the first part of number movement pattern value is "+". The second number, 13, is the same as in previous draw, so the pattern continues with "=" sign. Number 14 is lower than number 16 at the same position in previous draw, so the next part of movement pattern is "-". The rest of the winning numbers are greater than the numbers in previous draw, so the movement pattern ends with "+++".
These statistics are available in summary form and also as per-ticket properties.
See also Digits Movement Patterns statistics and Number Movement Pattern filter.
With combined statistics it is possible to group up to five different statistics into a new, single statistical property and thus track the combination of statistical properties as a single event. Expert Lotto ships with three predefined combined statistics:
Use menu Tools - Options - Statistics to define new combined statistics or to customize the existing ones.
These statistics track the occurrence of combinations of odd/even numbers and low/high numbers.
Ticket 1-2-3-4-5-6 has 3 odd numbers and 3 even numbers. All its numbers are low. So the Odd/Even + Low/High column in e.g. Package Properties window shows value 3:3 - 6:0 for this ticket.
The latest winning numbers in Expert Lotto 6/49 Demo Lottery are 23-29-36-42-44-47-[07]. Three numbers are odd and three numbers are even, 1 number is low (23) and five numbers are high. So the Odd/Even + Low/High column in e.g. Winning Numbers Properties window shows value 3:3 - 1:5 for this draw.
These statistics are available in summary form and also as per-ticket properties.
See also Combined Statistics and Odd/Even and Low/High ticket filters.
These statistics track the occurrence of combinations of sum root values and odd/even numbers.
The sum of ticket numbers 1-2-3-4-5-6 is 27. Sum root value is then 2+7=9. Three numbers are odd and three numbers are even. So the Sum Root + Odd/Even column in e.g. Package Properties window shows value 7 - 3:3 for this ticket.
The latest winning numbers in Expert Lotto 6/49 Demo Lottery are 23-29-36-42-44-47-[07]. The sum of these numbers is 221 therefore the sum root value is 2+2+1 = 5. Three numbers are odd and three numbers are even. So the Sum Root + Odd/Even column in e.g. Winning Numbers Properties window shows value 5 - 3:3 for this draw.
These statistics are available in summary form and also as per-ticket properties.
See also Combined Statistics and Sum Root and Odd/Even ticket filters.
These statistics track the occurrence of combinations of sum root values and low/high numbers.
The sum of ticket numbers 1-2-3-4-5-6 is 27. Sum root value is then 2+7=9. All the numbers are low. So the Sum Root + Low/High column in e.g. Package Properties window shows value 7 - 6:0 for this ticket.
The latest winning numbers in Expert Lotto 6/49 Demo Lottery are 23-29-36-42-44-47-[07]. The sum of these numbers is 221 therefore the sum root value is 2+2+1 = 5. One number is low (23) and five numbers are high. So the Sum Root + Low/High column in e.g. Winning Numbers Properties window shows value 5 - 1:5 for this draw.
These statistics are available in summary form and also as per-ticket properties.
See also Combined Statistics and Sum Root and Low/High ticket filters.
These statistics track how numbers in analyzed tickets fall into user-defined number groups.
For example the default number groups in Expert Lotto 6/49 Demo Lottery are
When analyzing e.g. the latest draw in Expert Lotto 6/49 Demo Lottery with winning numbers 23-29-36-42-44-47-[07] then column Number Groups Distribution in e.g. Winning Numbers Properties windows shows value 0-0-2-1-3. It means that analyzed draw has zero numbers from Group 1, zero numbers from Group 2, two numbers (23 and 29) from Group 3, one number (36) from Group 4 and two numbers (44 and 47) from Group 5.
Number Group Count column in the same window shows how many groups the analyzed numbers fall in. In this case the latest draw has numbers from three different groups (Group 3, Group 4 and Group 5) so that column shows value of 3 for the latest draw.
These statistics are available in summary form and also as per-ticket properties.
See also Number Group and Number Groups Patterns filters and Number Groups Distribution and Number Group Repeats statistics.
Number Group Repeats statistical property shows how many number within each number group repeat from previous draw.
For example the latest 2 draws in Expert Lotto 6/49 Demo Lottery are:
| 2010/28 Sun 2nd | 23 | 29 | 36 | 42 | 44 | 47 | [07] |
| 2010/28 Sun 1st | 06 | 13 | 14 | 19 | 41 | 42 | [29] |
When using the default Number Groups defined for x/49 lottery (1-10, 11-20, 21-30, 31-40 and 41-49), we can see that only one number in draw 2010/28 Sun 2nd repeats from the previous draw. It is number 42 which comes from the last number group. So the Number Groups Repeats statistical property of the latest draw is 0-0-0-0-1
These statistics show the best match of the analyzed ticket that was found in 5, 10 and 15 latest draws.
For example the latest 10 draws in Expert Lotto 6/49 Demo Lottery are:
| 2010/28 Sun 2nd | 23 | 29 | 36 | 42 | 44 | 47 | [07] |
| 2010/28 Sun 1st | 06 | 13 | 14 | 19 | 41 | 42 | [29] |
| 2010/28 Wed 2nd | 02 | 13 | 16 | 17 | 25 | 40 | [27] |
| 2010/28 Wed 1st | 16 | 18 | 22 | 23 | 28 | 29 | [24] |
| 2010/27 Sun 2nd | 01 | 06 | 12 | 24 | 32 | 41 | [44] |
| 2010/27 Sun 1st | 02 | 15 | 22 | 29 | 30 | 37 | [42] |
| 2010/27 Wed 2nd | 20 | 23 | 25 | 30 | 33 | 35 | [07] |
| 2010/27 Wed 1st | 08 | 11 | 19 | 26 | 48 | 49 | [18] |
| 2010/26 Sun 2nd | 08 | 11 | 18 | 32 | 36 | 38 | [06] |
| 2010/26 Sun 1st | 05 | 06 | 11 | 31 | 40 | 43 | [32] |
When the latest draw 2010/28 Sun 2nd (orange background) is compared to 5 previous draws (blue background) then the best match found is two numbers. Numbers 23 and 29 in the latest draw repeat in draw 2010/28 Wed 1st. So the table cell in column Match Previous 5 in Winning Numbers Properties window shows value of 2 for the latest draw.
When calculating the same property for draw 2010/28 Wed 2nd then its winning numbers are compared with draws 2010/28 Wed 1st to 2010/27 Wed 1st and the best match found is just one number. For example number 16 from the previous draw or number 2 from draw 2010/27 Sun 1st. So the table cell in column Match Previous 5 in Winning Numbers Properties window shows value of 1 for this draw.
Column Match Previous 10 shows the best match found in ten previous draws and column Match Previous 15 shows the best match found in fifteen previous draws.
Note: The corresponding values in Package Properties window apply to the selection of past winning numbers made in Options window.
These statistics are available in summary form and also as per-ticket properties.
See also Match Winning Numbers and Highest Match ticket filters.
These statistics show the maximum count of numbers each analyzed ticket or draw has in ticket panel's row and in ticket panel's column.
For example when analyzing the latest draw in Expert Lotto 6/49 Demo Lottery with winning numbers 23-29-36-42-44-47-[7] then column Max In Row in e.g. Winning Numbers Properties window shows value 2 because there are at most two numbers at any row in Ticket Panel window. Column Max In Column in the same window shows value 2 because there are at most two numbers in any column in Ticket Panel window.
These statistics are available in summary form and also as per-ticket properties.
See also Ticket Panel filter.
This statistical property shows the standard deviation of analyzed ticket numbers. Standard deviation is a mathematical formula, which evaluates how close are the ticket numbers to each other. Low standard deviation values mean that ticket numbers are very close to each other in the number pool. High standard deviation values mean that ticket numbers are from different parts of number pool.
See also Standard Deviation ticket filter.
Draw Interval statistical properties how many draws the winning numbers skipped before being drawn in the analyzed draw.
The latest two draws in Expert Lotto 6/49 Demo lottery are:
| 2010/28 Sun 2nd | 23 | 29 | 36 | 42 | 44 | 47 | [07] |
| 2010/28 Sun 1st | 06 | 13 | 14 | 19 | 41 | 42 | [29] |
Number intervals for draw 2010/28 Sun 2nd are 3-3-8-1-11-10. It means that numbers 23 and 29 were last drawn three draws ago (draw 2010/28 Wed 1st). Previous occurrence of number 36 is eight draws ago (2010/26 Sun 2nd). Number 42 was last drawn in the previous draw, hence value "1" at appropriate position in the statistical value. The same applies for other ticket numbers.
Ticket interval is the average count of draws that elapsed since the previous occurrence of each ticket number. Individual number intervals for draw 2010/28 Sun 2nd are 3-3-8-1-11-10. So the ticket interval value is (3+3+8+1+11+10)/6 = 6.0
Interval sum is the sum of the count of draws that elapsed since the previous occurrence of each ticket number. Individual number intervals for draw 2010/28 Sun 2nd are 3-3-8-1-11-10. So the interval sum value is 3+3+8+1+11+10 = 36
Positional ticket interval is the average count of draws that elapsed since the previous occurrence of each ticket number at the same ticket position. Individual number intervals for draw 2010/28 Sun 2nd are 281-164-50-200-11-10. So the positional ticket interval value is (281-164-50-200-11-10)/6 = 119.33
Positional inteval sum is the sum of the count of draws that elapsed since the previous occurrence of each ticket number at the same ticket position. Individual number intervals for draw 2010/28 Sun 2nd are 281-164-50-200-11-10. So the positional interval value is 281-164-50-200-11-10 = 716
This property shows how many draws elapsed since the previous occurrence of each ticket number at the same position. Positional number intervals for the latest draw 2010/28 Sun 2nd are 281-164-50-200-11-10. It means that for example number 23 was last draw at the first ticket position 281 draws ago.
Knight's Move statistics compare the winning numbers of analyzed draw/ticket with the winning numbers from the previous draw. The statistics then show how many numbers from the previous draw made chess-like knight's move into the analyzed draw. Knight's move is defined as follows:
Let's arrange all pool numbers into a grid with 10 columns:
1 |
2 |
3 |
4 |
5 |
6 |
7 |
8 |
9 |
10 |
11 |
12 |
13 |
14 |
15 |
16 |
17 |
18 |
19 |
20 |
21 |
22 |
23 |
24 |
25 |
26 |
27 |
28 |
29 |
30 |
31 |
32 |
33 |
34 |
35 |
36 |
37 |
38 |
39 |
40 |
41 |
42 |
43 |
44 |
45 |
46 |
47 |
48 |
49 |
As you can see, number 1 can make L-shaped knight's move to numbers 13 or 22 respectively. For example number 28 can jump to numbers 7, 9, 16, 20, 36, 40, 47, 49 - highlighted with blue background in the table above. The same rules apply to other pool numbers.
The statistics are given for the whole analyzed ticket and also per-position when the analyzed numbers are compared with previously drawn numbers at the same ticket positions.
Let's look at the following two draws in Expert Lotto 6/49 Demo lottery:
| 2010/28 Wed 1st | 16 | 18 | 22 | 23 | 28 | 29 | [24] |
| 2010/27 Sun 2nd | 01 | 06 | 12 | 24 | 32 | 41 | [44] |
Per-ticket Knight's Move statistics for draw 2010/28 Wed 1st show that there 3 numbers that knight-moved from the previous draw. Number 24 from previous draw jumped to number 16 in the analyzed draw. Number 6 made L-shaped move to number 18 and number 41 jumped to number 22.
When we compare the numbers at the same ticket positions then there's only number 6 at the second ticket position which jumped to number 18 at the same ticket position.
These statistics are available in summary form and also as per-ticket properties.
See also Knight's Move filter.
These statistics give the count of prime numbers in analyzed tickets.
Prime numbers in the range of 1 to 100 are 2, 3, 5, 7, 11, 13, 17, 19, 23, 29, 31, 37, 41, 43, 47, 53, 59, 61, 67, 71, 73, 79, 83, 89, 97
These statistics are available in summary form and also as per-ticket properties.
Arithmetic complexity shows the variations of differences between the numbers of analyzed tickets. The formulae is:
Arithmetic Complexity(t) = D(t) - (r-1)
where D(t) is the count of unique differences between all ticket numbers and r is the count of numbers in the analyzed ticket.
In a 6/xx lottery the Arithmetic Complexity value ranges from 0 to 10. About 74% of all possible combinations have the Arithmetic Complexity value in the range of 8 to 10.
Let's analyze ticket 1-2-3-4-5-6. The differences between all ticket numbers are:
2-1 = 1
3-1 = 2
4-1 = 3
5-1 = 4
6-1 = 5
3-2 = 1
4-2 = 2
5-2 = 3
6-2 = 4
4-3 = 1
5-3 = 2
6-3 = 3
5-4 = 1
6-4 = 2
6-5 = 1
There are 5 unique differences: 1, 2, 3, 4, 5 so the Arithmetic Complexity of this ticket is 5-(6-1) = 0
The same analysis of ticket 1-2-4-8-13-21 shows the following differences:
2-1 = 1
4-1 = 3
8-1 = 7
13-1 = 12
21-1 = 20
4-2 = 2
8-2 = 6
13-2 = 11
21-2 = 19
8-4 = 4
13-4 = 9
21-4 = 17
13-8 = 5
21-8 = 13
21-13 = 8
None of the differences above repeat so there are 15 unique differences so the Arithmetic Complexity of this ticket is 15-(6-1)=10
These statistics are available in summary form and also as per-ticket properties.
See also Arithmetic Complexity filter.
This statistics gives the maximum count of first and last digits that are consecutive regardless of their order within the analyzed tickets.
Each pool number breaks down into two digits. The first digit is the leading digit of the number, the last digit is the second digit of the number. For example the first digit of number 23 is 2, the last digit of that number is 3. The first digit of number 9 is 0, the last digit of that number is 9.
For example the latest draw in Expert Lotto 6/49 Demo lottery is 23-29-36-42-44-47. The first digits of that draw are 2, 2, 3, 4, 4, 4. The longest sequence of consecutive digits is 2-3-4 so the value of Consecutive First Digits (any order) for the latest draw is 3.
The last digits of the latest draw are 3, 9, 6, 2, 4, 7. When sorted in ascending order the last digits are 2, 3, 4, 6, 7, 9. We can see that the longest consecutive sequence is 2-3-4 so the value of Consecutive Last Digits (any order) for the latest draw is 3.
These statistics are available in summary form and also as per-ticket properties.
See also Consecutive Digits In Any Order ticket filter.
Digits Movement shows how first/last digits changed when compared with previous draw.
For example the latest two draws in Expert Lotto 6/49 Demo lottery are:
| 2010/28 Sun 2nd | 23 | 29 | 36 | 42 | 44 | 47 | [07] |
| 2010/28 Sun 1st | 06 | 13 | 14 | 19 | 41 | 42 | [29] |
So the movement of first digits in draw 2010/28 Sun 2nd is ++++==
That means the first digits at the first four ticket positions are greater than first digits at the same positions in previous draw. And that the last two first digits are the same as in previous draw.
The movement of last digits in the same draw is -++-++
That means the last digit at the first ticket position is lower than in the previous draw (see the last digit 3 in the latest draw and the last digit 6 in the previous draw). The next two ticket positions have higher last digits. The last digit of number 42 in the latest draw is 2 which is lower than the last digit 9 of number 19 from the previous draw. Hence "-" sign in the property value. The last two last digits are greater than the last digits in the previous draw.
These statistics are available in summary form and also as per-ticket properties.
See also Number Movement Patterns and Digits Movement Patterns filter.
This statistical property tracks the occurrences of pool numbers at individual ticket positions.
When analyzing e.g. the latest draw in Expert Lotto 6/49 Demo Lottery with winning numbers 23-29-36-42-44-47-[7] then column Position 1 in e.g. Winning Numbers Properties window shows value of 23. Column Position 2 shows value of 29 because the second ticket number is 29 etc.See also Numbers at Positions ticket filter and Ticket Numbers statistics.
This statistical property tracks the occurrences of bonus and powerball numbers.
When analyzing e.g. the latest draw in Expert Lotto 6/49 Demo Lottery with winning numbers 23-29-36-42-44-47-[7] then column Bonus in e.g. Winning Numbers Properties window shows value of 7.Note: Bonus numbers statistics are available only when analyzing tickets with bonus numbers or powerball numbers.
See also Bonus Numbers ticket filter and Bonus Numbers statistics.
These statistics track the occurrences of first and last digits at individual ticket positions. Each pool number breaks down into two digits. The first digit is the leading digit of the number, the last digit is the second digit of the number. For the first digit of number 23 is 2, the last digit of that number is 3. The first digit of number 9 is 0, the last digit of that number is 9.
For example in Expert Lotto 6/49 Demo Lottery the 10 latest draws are:
| 2010/28 Sun 2nd | 23 | 29 | 36 | 42 | 44 | 47 | [07] |
| 2010/28 Sun 1st | 06 | 13 | 14 | 19 | 41 | 42 | [29] |
| 2010/28 Wed 2nd | 02 | 13 | 16 | 17 | 25 | 40 | [27] |
| 2010/28 Wed 1st | 16 | 18 | 22 | 23 | 28 | 29 | [24] |
| 2010/27 Sun 2nd | 01 | 06 | 12 | 24 | 32 | 41 | [44] |
| 2010/27 Sun 1st | 02 | 15 | 22 | 29 | 30 | 37 | [42] |
| 2010/27 Wed 2nd | 20 | 23 | 25 | 30 | 33 | 35 | [07] |
| 2010/27 Wed 1st | 08 | 11 | 19 | 26 | 48 | 49 | [18] |
| 2010/26 Sun 2nd | 08 | 11 | 18 | 32 | 36 | 38 | [06] |
| 2010/26 Sun 1st | 05 | 06 | 11 | 31 | 40 | 43 | [32] |
First Digit analysis shows that the most frequent digit at the first
ticket position is 0. It is because seven of the analyzed draws have
the first drawn number lower than 10. That means the first digit is 0 - highlighted with blue background in the table above.
The
same analysis of Last Digits shows that the most frequent last digits
at ticket position 6 are digits 7 and 9 - highlighted with orange
background in the table above.
These statistics are available in summary form and also as per-ticket properties.
See also Positional First/Last Digit filter.
These statistics compare the winning numbers of analyzed draw with winning numbers from previous draw. When analyzing Package tickets then the ticket numbers are compared with the latest draw from the selection of past winning numbers draws made in Options window.
For example the winning numbers of the latest draw in Expert Lotto 6/49 Demo Lottery are 23-29-36-42-44-47-[07], winning numbers from the previous draw are 06-13-14-19-41-42-[29]. So number movement at the first ticket position is 23-6=17, number movement at the second ticket position is 29-13=16, movement at the third ticket position is 36-14=22 etc. The sum of all number movement values is 17+16+22+23+3+5=86
When analyzing Package ticket, e.g. 21-27-36-38-41-48 then number movement corresponding to the latest draw will be 21-23=-2 at the first ticket position, 27-29=-2 at the second ticket position, 36-36=0 at the third position etc. The sum of all number movement values is -2-2+0-4-3+1=-10.
These statistics are available in summary form and also as per-ticket properties.
See also Number Movement filter.
Number Movement Patterns compares the number of analyzed draw/ticket with the winning numbers of the previous draw.
For example the latest three draws in Expert Lotto 6/49 Demo lottery are:
| 2010/28 Sun 2nd | 23 | 29 | 36 | 42 | 44 | 47 | [07] |
| 2010/28 Sun 1st | 06 | 13 | 14 | 19 | 41 | 42 | [29] |
| 2010/28 Wed 2nd | 02 | 13 | 16 | 17 | 25 | 40 | [27] |
The Number Movement Pattern for draw 2010/28 Sun 2nd is ++++++ because all its winning numbers are greater than numbers at appropriate position in the previous draw.
The movement pattern for draw 2010/28 Sun 1st is +=-+++. The first winning number is 6 which is greater than number 2 at previous draw, so the first part of number movement pattern value is "+". The second number, 13, is the same as in previous draw, so the pattern continues with "=" sign. Number 14 is lower than number 16 at the same position in previous draw, so the next part of movement pattern is "-". The rest of the winning numbers are greater than the numbers in previous draw, so the movement pattern ends with "+++".
These statistics are available in summary form and also as per-ticket properties.
See also Digits Movement Patterns statistics and Number Movement Pattern filter.
Digits Movement shows how first/last digits changed when compared with previous draw.
For example the latest two draws in Expert Lotto 6/49 Demo lottery are:
| 2010/28 Sun 2nd | 23 | 29 | 36 | 42 | 44 | 47 | [07] |
| 2010/28 Sun 1st | 06 | 13 | 14 | 19 | 41 | 42 | [29] |
So the movement of first digits in draw 2010/28 Sun 2nd is ++++==
That means the first digits at the first four ticket positions are greater than first digits at the same positions in previous draw. And that the last two first digits are the same as in previous draw.
The movement of last digits in the same draw is -++-++
That means the last digit at the first ticket position is lower than in the previous draw (see the last digit 3 in the latest draw and the last digit 6 in the previous draw). The next two ticket positions have higher last digits. The last digit of number 42 in the latest draw is 2 which is lower than the last digit 9 of number 19 from the previous draw. Hence "-" sign in the property value. The last two last digits are greater than the last digits in the previous draw.
These statistics are available in summary form and also as per-ticket properties.
See also Number Movement Patterns and Digits Movement Patterns filter.
Digits Movement shows how first/last digits changed when compared with previous draw.
For example the latest two draws in Expert Lotto 6/49 Demo lottery are:
| 2010/28 Sun 2nd | 23 | 29 | 36 | 42 | 44 | 47 | [07] |
| 2010/28 Sun 1st | 06 | 13 | 14 | 19 | 41 | 42 | [29] |
So the movement of first digits in draw 2010/28 Sun 2nd is ++++==
That means the first digits at the first four ticket positions are greater than first digits at the same positions in previous draw. And that the last two first digits are the same as in previous draw.
The movement of last digits in the same draw is -++-++
That means the last digit at the first ticket position is lower than in the previous draw (see the last digit 3 in the latest draw and the last digit 6 in the previous draw). The next two ticket positions have higher last digits. The last digit of number 42 in the latest draw is 2 which is lower than the last digit 9 of number 19 from the previous draw. Hence "-" sign in the property value. The last two last digits are greater than the last digits in the previous draw.
These statistics are available in summary form and also as per-ticket properties.
See also Number Movement Patterns and Digits Movement Patterns filter.
This statistical property tracks the occurrence of odd and even numbers at individual ticket positions.
For example when analyzing ticket numbers 1-2-3-4-5-6 then column Odd/Even 1 in e.g. Package Properties window shows value odd because the first ticket number is odd. Column Odd/Even 2 shows value even because the second ticket number is even.
See also Positional Odd/Even ticket filter.
This statistical property tracks the occurrence of low and high numbers at individual ticket positions. Number is low when it is in the lower half of number pool, number is high when it is in the upper half of number pool.
For example in a x/40 lottery, numbers 1 to 20 are low, numbers 21 to 40 are high numbers. In a x/49 lottery, numbers 1 to 24 are low, numbers 25 to 49 are high.
When analyzing e.g. the latest draw in Expert Lotto 6/49 Demo Lottery with winning numbers 23-29-36-42-44-47-[7] then column Low/High 1 in e.g. Winning Numbers Properties window shows value low because the first ticket number is low. Column Low/High 2 shows value high because the second ticket number is high.
See also Positional Low/High ticket filter.
These statistics analyze the difference of ticket numbers at neighboring ticket positions.
For example in Expert Lotto 6/49 Demo Lottery the 10 latest draws are:
| 2010/28 Sun 2nd | 23 | 29 | 36 | 42 | 44 | 47 | [07] |
| 2010/28 Sun 1st | 06 | 13 | 14 | 19 | 41 | 42 | [29] |
| 2010/28 Wed 2nd | 02 | 13 | 16 | 17 | 25 | 40 | [27] |
| 2010/28 Wed 1st | 16 | 18 | 22 | 23 | 28 | 29 | [24] |
| 2010/27 Sun 2nd | 01 | 06 | 12 | 24 | 32 | 41 | [44] |
| 2010/27 Sun 1st | 02 | 15 | 22 | 29 | 30 | 37 | [42] |
| 2010/27 Wed 2nd | 20 | 23 | 25 | 30 | 33 | 35 | [07] |
| 2010/27 Wed 1st | 08 | 11 | 19 | 26 | 48 | 49 | [18] |
| 2010/26 Sun 2nd | 08 | 11 | 18 | 32 | 36 | 38 | [06] |
| 2010/26 Sun 1st | 05 | 06 | 11 | 31 | 40 | 43 | [32] |
Number Distance analysis shows that the most frequent distance between numbers at the second and the first ticket positions is 3. It was found in three analyzed draws - see table cells with blue background above. The same analysis also shows that the most frequent distance between numbers at ticket position 6 and 5 is 1. It was found in 3 analyzed draws - see table cells with orange background above.
Number Distance statistical properties of the latest draw in e.g. Winning Numbers Properties window show the Distance 2-1 is 6. Second number 29 minus the first number 23 equals 6. Value in Distance 3-2 column is 7 because 36-29=7. The same applies to other ticket positions.
Distance 1-0 is just a convenience value showing the number at the first ticket position.
Distance 6-1 is the distance between the last ticket number and the first ticket number (in a 6/xx lottery).
These statistics are available in summary form and also as per-ticket properties.
Number Range statistics divide the whole number pool into several chunks. Each chunk has either 5 or 10 numbers. So when playing e.g. x/49 lottery the pool will be divided into ten chunks of five numbers (1-5, 6-10, 11-15, ... , 41-45, 46-49) and five chunks of ten numbers (1-10, 11-20, ... , 41-49).
The statistics evaluate each ticket position and show which chunk the number at the given position fall into.
For example the latest draw in Expert Lotto 6/49 Demo Lottery is 23-29-36-42-44-47 so when using 5-number ranges the first number falls into range 21-25. When using 10-number ranges the first number falls into range 21-30.
These statistics are available in summary form and also as per-ticket properties.
Vertical Pair Sum statistics track the sum of a ticket number at a given position and a number at the same position in selected previous draw. The distance between the draws being compared is adjustable in Options window.
When the draw distances are set to 1, 5 and 10 in the Options then Winning Numbers Properties window will show for example the following values in Expert Lotto 6/49 Demo Lottery:
| Vertical Pair Sum 1 [1] | Vertical Pair Sum 3 [5] | Vertical Pair Sum 6 [10] | ||||||||
| 2010/28 Sun 2nd | 23 | 29 | 36 | 42 | 44 | 47 | [07] | 29 | 58 | 94 |
| 2010/28 Sun 1st | 06 | 13 | 14 | 19 | 41 | 42 | [29] | 8 | 39 | 88 |
| 2010/28 Wed 2nd | 02 | 13 | 16 | 17 | 25 | 40 | [27] | 18 | 35 | 83 |
| 2010/28 Wed 1st | 16 | 18 | 22 | 23 | 28 | 29 | [24] | 17 | 40 | 75 |
| 2010/27 Sun 2nd | 01 | 06 | 12 | 24 | 32 | 41 | [44] | 3 | 23 | 90 |
| 2010/27 Sun 1st | 02 | 15 | 22 | 29 | 30 | 37 | [42] | 22 | 48 | 77 |
| 2010/27 Wed 2nd | 20 | 23 | 25 | 30 | 33 | 35 | [07] | 28 | 50 | 84 |
| 2010/27 Wed 1st | 08 | 11 | 19 | 26 | 48 | 49 | [18] | 16 | 47 | 88 |
| 2010/26 Sun 2nd | 08 | 11 | 18 | 32 | 36 | 38 | [06] | 13 | 42 | 79 |
| 2010/26 Sun 1st | 05 | 06 | 11 | 31 | 40 | 43 | [32] | 9 | 34 | 91 |
| 2010/26 Wed 2nd | 04 | 18 | 26 | 33 | 35 | 47 | [11] | 9 | 48 | 89 |
Value in column Vertical Pair Sum 1 [1] shows the sum of ticket numbers at the first ticket positions when the draw distance is 1.
Value in column Vertical Pair Sum 3 [5] shows the sum of ticket numbers at the third ticket positions when the draw distance is 5.
Value in column Vertical Pair Sum 6 [5] shows the sum of ticket numbers at the last ticket positions when the draw distance is 10.
These statistics are available in summary form and also as per-ticket properties.
See also Vertical Pairs Filter.
Winning numbers of each draw divide the number pool into six consecutive ranges (applies to 6/xx lottery). If the latest winning numbers are for example 23-29-36-42-44-47 then the ranges are:1 to 23,
24 to 29,
30 to 36,
37 to 42,
43 to 44 and
45 to 49.
For example ticket 15-25-31-33-41-49 then has the following distribution pattern: XXX--X. The first number 15 fits into the first range (1 to 23) so the first part of the pattern is X. Second number 25 also fits into the second range (24 to 29) so the pattern continues with X. Number 31 is in the second range so the pattern has X at the third position. Numbers 31 and 41 do not fit into ranges at appropriate positions so the pattern shows - at fourth and fifth positions. The last number 49 fits into the last range so the last part of the distribution pattern is X. In total there are 4 numbers that fit into ranges of the previous draw.
Note: The first range always starts with the lowest pool number. The last number range always ends with the highest pool number.
For example the latest 5 draws in Expert Lotto 6/49 Demo Lottery and their distribution patterns are:
2010/28 Sun 2nd, 23-29-36-42-44-47-[07] -----X
2010/28 Sun 1st, 06-13-14-19-41-42-[29] -XX--X
2010/28 Wed 2nd, 02-13-16-17-25-40-[27] X---XX
2010/28 Wed 1st, 16-18-22-23-28-29-[24] ---XX-
2010/27 Sun 2nd, 01-06-12-24-32-41-[44] XX-X-X
Looking at the table above we can see that for example only the last number (47) of the latest draw fits into ranges defined by the previous draw 2010/28 Sun 1st. The matching range is 42 to 47. The distribution pattern of the latest draw is then -----X.
These statistics track how many analyzed ticket numbers fit into ranges defined by the numbers of the previous draw.
For example the latest 5 draws in Expert Lotto 6/49 Demo Lottery are:
| Date | Numbers | In Range Count | ||||||
| 2010/28 Sun 2nd | 23 | 29 | 36 | 42 | 44 | 47 | [07] | 1 |
| 2010/28 Sun 1st | 06 | 13 | 14 | 19 | 41 | 42 | [29] | 3 |
| 2010/28 Wed 2nd | 02 | 13 | 16 | 17 | 25 | 40 | [27] | 3 |
| 2010/28 Wed 1st | 16 | 18 | 22 | 23 | 28 | 29 | [24] | 2 |
| 2010/27 Sun 2nd | 01 | 06 | 12 | 24 | 32 | 41 | [44] | 4 |
From the table above we can see that this statistics simply gives the count of X symbols in Range Patterns distribution.
For example the latest draw 2010/28 Sun 2nd has only one number in the ranges defined by previous draw 2010/28 Sun 1st. It is number 47 highlighted with blue color in the table above.
Draw 2010/28 Wed 2nd has three such numbers. Number 2 is in the first range 1 to 16. Number 25 is in the range 18 to 25 and the last number 40 fits into range 26 to 49. The matching numbers are highlighted with orange color in the table above.
In Range Count statistics is available in summary form and also as per-ticket property.
See also Range Patterns ticket filter.
These statistics show the count of hot numbers and the count of cold numbers in analyzed draws or tickets. Numbers are hot when they have been drawn very frequently in the last few draws, cold numbers are those which haven't been drawn at all or only once or twice in the last few draws.
The minimum count of hits of hot numbers and the maximum allowed hits of cold numbers are adjustable in application options under menu Tools - Options - Number Coloring - Hot/Cold.
If you analyze the whole winning numbers database of Expert Lotto 6/49 Demo lottery you will find out that winning numbers very frequently contain 0 to 2 cold numbers from previous draws. There are also very often 0 to 2 hot numbers in any past draw.
Note: the example above applies to Hot/Cold options set to Maximum frequency of cold numbers: 1, Minimum frequency of hot numbers: 4, Scan for hot/cold numbers in 20 latest draws.
These statistics are available in summary form and also as per-ticket properties.
See also Hot/Cold Numbers filter and Hot/Cold Numbers coloring.
Shows the distribution of ticket numbers into a matrix of all pool numbers. There are four ways to arrange pool numbers into a matrix. Each row of such matrix represents one group of numbers. The statistics show the distribution of analyzed ticket numbers into the groups.
The examples below are given for Expert Lotto 6/49 demo lottery which has the latest drawn numbers 23-29-36-42-44-47-[7].
This matrix has five columns, the numbers are arranged from the top to the bottom. The count of rows depends on the pool size.
1 |
11 |
21 |
31 |
41 |
2 |
12 |
22 |
32 |
42 |
3 |
13 |
23 |
33 |
43 |
4 |
14 |
24 |
34 |
44 |
5 |
15 |
25 |
35 |
45 |
6 |
16 |
26 |
36 |
46 |
7 |
17 |
27 |
37 |
47 |
8 |
18 |
28 |
38 |
48 |
9 |
19 |
29 |
39 |
49 |
10 |
20 |
30 |
40 |
Each ticket number is on a separate table row so the 5 Vertical matrix distribution for the latest winning numbers is 1-1-1-1-1-1
This matrix has five columns, the numbers are arranged from left to the right. The count of rows depends on the pool size.
| 1 | 2 | 3 | 4 | 5 |
| 6 | 7 | 8 | 9 | 10 |
| 11 | 12 | 13 | 14 | 15 |
| 16 | 17 | 18 | 19 | 20 |
| 21 | 22 | 23 | 24 | 25 |
| 26 | 27 | 28 | 29 | 30 |
| 31 | 32 | 33 | 34 | 35 |
| 36 | 37 | 38 | 39 | 40 |
| 41 | 42 | 43 | 44 | 45 |
| 46 | 47 | 48 | 49 |
Two ticket numbers are on the same row so the 5 Horizontal matrix distribution is 2-1-1-1-1.
This matrix has 9 columns, the numbers are arranged from the top to the bottom. The count of rows depends on the pool size.
1 |
7 |
13 |
19 |
25 |
31 |
37 |
43 |
49 |
2 |
8 |
14 |
20 |
26 |
32 |
38 |
44 |
|
3 |
9 |
15 |
21 |
27 |
33 |
39 |
45 |
|
4 |
10 |
16 |
22 |
28 |
34 |
40 |
46 |
|
5 |
11 |
17 |
23 |
29 |
35 |
41 |
47 |
|
6 |
12 |
18 |
24 |
30 |
36 |
42 |
48 |
Three analyzed numbers are on the same row (23,29 and 47), two numbers are on another row and a single number 44 is on another row. The 9 Vertical matrix distribution value is then 3-2-1.
This matrix has 9 columns, the numbers are arranged from the left to the right. The count of rows depends on the pool size.
1 |
2 |
3 |
4 |
5 |
6 |
7 |
8 |
9 |
10 |
11 |
12 |
13 |
14 |
15 |
16 |
17 |
18 |
19 |
20 |
21 |
22 |
23 |
24 |
25 |
26 |
27 |
28 |
29 |
30 |
31 |
32 |
33 |
34 |
35 |
36 |
37 |
38 |
39 |
40 |
41 |
42 |
43 |
44 |
45 |
46 |
47 |
48 |
49 |
Two numbers are on separate rows (23 and 47), the rest of the numbers are evenly distributed into two rows. So the 9 Horizontal matrix distribution value is 2-2-1-1.
This matrix has 10 columns, the numbers are arranged from the top to the bottom. The count of rows depends on the pool size.
1 |
6 |
11 |
16 |
21 |
26 |
31 |
36 |
41 |
46 |
2 |
7 |
12 |
17 |
22 |
27 |
32 |
37 |
42 |
47 |
3 |
8 |
13 |
18 |
23 |
28 |
33 |
38 |
43 |
48 |
4 |
9 |
14 |
19 |
24 |
29 |
34 |
39 |
44 |
49 |
5 |
10 |
15 |
20 |
25 |
30 |
35 |
40 |
45 |
Two analyzed numbers are on the same row (42 and 47), two numbers are on another row (29 and 44) and two remaining numbers are each on another row. The 10 Vertical matrix distribution value is then 2-2-1-1.
This matrix has 10 columns, the numbers are arranged from the left to the right. The count of rows depends on the pool size.
1 |
2 |
3 |
4 |
5 |
6 |
7 |
8 |
9 |
10 |
11 |
12 |
13 |
14 |
15 |
16 |
17 |
18 |
19 |
20 |
21 |
22 |
23 |
24 |
25 |
26 |
27 |
28 |
29 |
30 |
31 |
32 |
33 |
34 |
35 |
36 |
37 |
38 |
39 |
40 |
41 |
42 |
43 |
44 |
45 |
46 |
47 |
48 |
49 |
Three numbers are on the same row (42, 44 and 47), two numbers are on a different row (23 and 29) and a single number is on another row. So the 10 Horizontal matrix distribution value is 3-2-1.
All these statistics are available in summary form and also as per-ticket properties.
This statistical property shows the History Sum values for tickets in the Package and for past winning numbers.
The property is added for convenience only as it provides the same information which is available in Summary History window under Sums tab.
This statistical property shows the History Differences values for tickets in the Package and for past winning numbers.
The property is added for convenience only as it provides the same information which is available in Summary History window under Sums tab.
This statistical property shows the ratio of odd History sums to even History sums for tickets in the Package and for past winning numbers.
The property is added for convenience only as it provides the same information which is available in Summary History window under Sums tab.
This statistical property shows the minimum and the maximum History Difference for tickets in the Package and for past winning numbers.
The property is added for convenience only as it provides the same information which is available in Summary History window under Sums tab.
This statistical property shows the count of negative and positive History Differences for tickets in the Package and for past winning numbers.
The property is added for convenience only as it provides the same information which is available in Summary History window under Sums tab.
This statistical property shows the standard deviation of History Differences for tickets in the Package and for past winning numbers.
The property is added for convenience only as it provides the same information which is available in Summary History window under Sums tab.
This statistical property shows the History Differences values for tickets in the Package and for past winning numbers.
The property is added for convenience only as it provides the same information which is available in Summary History window under Sums tab.
These statistics track how many numbers from analyzed draws/tickets have unique History number difference value in a given Level. A ticket number has unique History difference if it appears alone on a row Segmentation table for given Level.
For example the winning numbers of the latest draw in Expert Lotto
6/49 Demo Lottery look like this in Segmentation table for Level 0 of
previous draw:
Numbers 23 and 29 have the same History difference of 3 so there are only 5 numbers with unique History number difference value in that draw.
Summary analysis of Unique Number Differences of 10 latest draws in that lottery then shows that the most frequent count of numbers with unique differences is 5 numbers as it was found in five of the analyzed draws.
See also Unique Number Differences filter.
These statistics are available in summary form and also as per-ticket properties.
This statistical property shows the distribution of numbers into History Segments for tickets in the Package and for past winning numbers.
The property is added for convenience only as it provides the same information which is available in Summary History window under Segmentation tab.
Shows the sum of History differences of the winning numbers of analyzed draw or ticket. The statistics are available for each History level and there is also the total sum across all levels.
The latest winning numbers in Expert Lotto 6/49 Demo lottery are 23-29-36-42-44-47-[7] (draw 2010/28 Sun 2nd). To find their History differences we must click menu History - Summary History, make sure Sums table is showing and then highlight preceding draw, i.e. draw 2010/28 Sun 1st. Then toggle Details button to show Number History details for that draw in the lower part of the Summary History window. We can see that the winning numbers of the latest draw are highlighted with a black border. The number differences of the latest draw in Level 0 are:
| Winning Number | Number Difference in Level 0 |
| 23 | 3 |
| 29 | 3 |
| 36 | 8 |
| 42 | 1 |
| 44 | 11 |
| 47 | 10 |
| Sum: | 36 |
The sum of all Number differences in Level 0 is 36 so the statistical property will be showing value 36 in column Number Differences Sum 0.
These statistics are available in summary form and also as per-ticket properties.
See also Number Differences Sum filter.
This statistics show how many History Differences fit into +/-10 range.
For example the latest two draws in Expert Lotto 6/49 Demo lottery have the following History differences:
| Level 0 | Level 1 | Level 2 | Level 3 | Level 4 | Level 5 | Level 6 | Level 7 | Level 8 | Level 9 | Level 10 | ||||||||
| 2010/28 Sun 2nd | 23 | 29 | 36 | 42 | 44 | 47 | [07] | +13 | -14 | -27 | +17 | +3 | +8 | +12 | -5 | +23 | +11 | +31 |
| 2010/28 Sun 1st | 06 | 13 | 14 | 19 | 41 | 42 | [29] | -3 | -28 | -16 | +16 | -35 | -7 | +9 | +7 | +25 | +16 | +21 |
You can see that in the latest draw 2010/28 Sun 2nd there are three Levels where the History difference is in the range of -10 to +10 (highlighted with blue background). In previous draw 2010/28 Sun 1st there are four such Levels (highlighted with green background).
If you analyze the whole winning numbers database of the Expert Lotto 6/49 Demo lottery you will find out that very frequently there are 4 to 5 Levels where the History differences are in the range -10 to +10.
![]() The range values are adjustable in application options under menu Tools - Options - History - Ranges. The default values are -10 to +10.
The range values are adjustable in application options under menu Tools - Options - History - Ranges. The default values are -10 to +10.
These statistics are available in summary form and also as per-ticket properties.
See also Sums History ticket filter - condition The difference in X to Y levels is at most A to B - and Difference Ranges statistics.
Shows whether the History sum value in a given draw and in given Level is greater or lower than the History sum value in previous draw. A plus sign (+) means the History sum is greater than the previous value, a minus sign (-) means the sum is lower. An equals sign (=) means the History sum is the same as in previous draw.
These statistics are available in summary form and also as per-ticket properties.
See also History Sum Movement filter and History Diff Movement statistics.
Shows whether the History difference value in a given draw and in given Level is greater or lower than the History difference value in previous draw. A plus sign (+) means the History difference is greater than the previous value, a minus sign (-) means the difference is lower. An equals sign (=) means the History difference is the same as in previous draw.
These statistics are available in summary form and also as per-ticket properties.
See also History Difference Movement filter and History Sum Movement statistics.
The statistics show the maximum count of consecutive History Levels that have either only negative or only positive History differences.
For example that latest draw 2010/28 Sun 2nd in the demo Expert Lotto 6/49 lottery has the following History difference values:
| Level | Diff |
|---|---|
| 0 | 13 |
| 1 | -14 |
| 2 | -27 |
| 3 | 17 |
| 4 | 3 |
| 5 | 8 |
| 6 | 12 |
| 7 | -5 |
| 8 | 23 |
| 10 | 11 |
| 11 | 31 |
You can see that the longest section of the table above that has only negative differences is between Levels 1 and 2 (orange background). So the Consecutive Neg Diffs for draw 2010/28 Sun 2nd is 2.
The longest section of the table that has only positive differences is between Levels 3 and 6 (blue background). So the Consecutive Pos Diffs for draw 2010/28 Sun 2nd is 4.
These statistics are available in summary form and also as per-ticket properties.
The statistics show how many History differences repeat in the same Level from previous draws. The statistics are given for repeats from a single previous draw and for repeats from 5, 10, 15, 30 and 50 previous draws.
For example draw 2010/27 Sun 1st in the demo Expert Lotto 6/49 lottery has two History differences repeated from the previous five draws. The History difference 14 in Level 3 repeats from draw 2010/26 Sun 2nd and History difference 6 in Level 6 repeats from the previous draw 2010/27 Wed 2nd.
These statistics are available in summary form and also as per-ticket properties.
The statistics show whether a History difference in a given Level is in pre-defined of -10 to +10, above that range or below that range. The value range is adjustable in application options under menu Tools - Options - History - Ranges. The default values are -10 to +10.
Value "in range" means that the History difference value is in pre-defined range. Value ">" means the difference is above the pre-defined range, value "<" means the differences is below the pre-defined range.
These statistics are available in summary form and also as per-ticket properties.
See also In Range Differences statistics.
History is a unique Expert Lotto feature which provides 100% guarantee of finding the Jackpot winning ticket if several History parameters are correctly estimates.
History is based on the latest occurrences of each winning number. Most of conventional lottery strategies analyze a fixed interval of past draws. However Expert Lotto History tracks fixed count of occurrences of each number no matter how long ago the number was drawn. By default History checks 11 latest occurrences of each number in the pool, however this count is adjustable in application preferences.
The picture below shows the matrix of winning numbers database
in
Expert Lotto 6/49 Demo Lottery without the very latest draw:
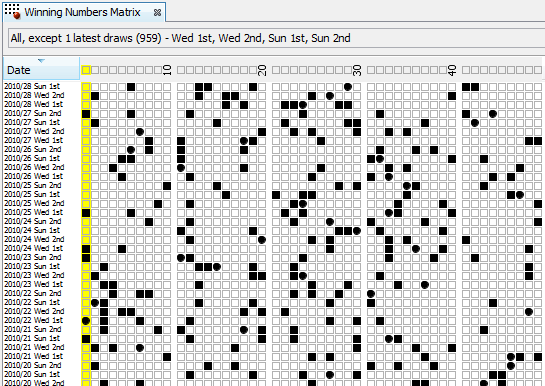
From the picture you can see that the latest occurrence of number 1 (highlighted with yellow color) happened 4 draws ago in the selected section of winning numbers database. Number 2 hit 2 draws ago, 21 draws elapsed since the latest occurrence of number 3, 10 draws elapsed since the last hit of number 4 etc. Arranged to a table the latest occurrences look like this:
| Number of draws elapsed since the latest hit of each number | |||||||||||||||||||||||||||||||||||||||||||||||||
| Number | 1 | 2 | 3 | 4 | 5 | 6 | 7 | 8 | 9 | 10 | 11 | 12 | 13 | 14 | 15 | 16 | 17 | 18 | 19 | 20 | 21 | 22 | 23 | 24 | 25 | 26 | 27 | 28 | 29 | 30 | 31 | 32 | 33 | 34 | 35 | 36 | 37 | 38 | 39 | 40 | 41 | 42 | 43 | 44 | 45 | 46 | 47 | 48 | 49 |
| Draws count | 4 | 2 | 21 | 10 | 9 | 1 | 24 | 7 | 14 | 12 | 7 | 4 | 1 | 1 | 5 | 2 | 2 | 3 | 1 | 6 | 13 | 3 | 3 | 4 | 2 | 7 | 18 | 3 | 3 | 5 | 9 | 4 | 6 | 14 | 6 | 8 | 5 | 8 | 14 | 2 | 1 | 1 | 9 | 11 | 33 | 11 | 10 | 7 | 7 |
The values in the second table row are called Level 0 in History terms.
When searching for previous hits of drawn numbers you can see from the picture above that the previous hit of number 1 happened 15 draws ago - in draw 2010/25 Wed 1st. Previous hit of number 2 can be found 5 draws ago, number 3 hit 24 draws ago etc. The table of previous hits looks like this:
| Number of draws elapsed since the second latest hit of each number | |||||||||||||||||||||||||||||||||||||||||||||||||
| Number | 1 | 2 | 3 | 4 | 5 | 6 | 7 | 8 | 9 | 10 | 11 | 12 | 13 | 14 | 15 | 16 | 17 | 18 | 19 | 20 | 21 | 22 | 23 | 24 | 25 | 26 | 27 | 28 | 29 | 30 | 31 | 32 | 33 | 34 | 35 | 36 | 37 | 38 | 39 | 40 | 41 | 42 | 43 | 44 | 45 | 46 | 47 | 48 | 49 |
| Draws count | 15 | 5 | 23 | 23 | 11 | 4 | 27 | 8 | 28 | 31 | 8 | 11 | 2 | 21 | 12 | 3 | 30 | 8 | 7 | 22 | 77 | 5 | 6 | 13 | 6 | 10 | 19 | 12 | 5 | 6 | 11 | 8 | 10 | 15 | 10 | 12 | 16 | 20 | 17 | 9 | 4 | 20 | 12 | 25 | 34 | 13 | 31 | 19 | 14 |
The values in the second table row are called Level 1 in History terms.
The same applies to other previous occurrences of each number up to Level 10 as by default the History tracks 11 latest occurrences of each number.
Now we can arrange tables for individual Levels into a grid to form a complete Number History:
| Number | Level 0 | Level 1 | Level 2 | Level 3 | Level 4 | Level 5 | Level 6 | Level 7 | Level 8 | Level 9 | Level 10 |
| 1 | 4 | 15 | 19 | 20 | 29 | 35 | 36 | 66 | 69 | 91 | 97 |
| 2 | 2 | 5 | 22 | 30 | 32 | 44 | 46 | 57 | 59 | 72 | 79 |
| 3 | 21 | 23 | 25 | 26 | 27 | 28 | 34 | 36 | 39 | 40 | 56 |
| 4 | 10 | 23 | 24 | 30 | 47 | 49 | 66 | 88 | 96 | 102 | 121 |
| 5 | 9 | 11 | 19 | 26 | 44 | 47 | 52 | 55 | 58 | 79 | 80 |
| 6 | 1 | 4 | 9 | 15 | 26 | 46 | 52 | 64 | 73 | 75 | 92 |
| 7 | 24 | 27 | 34 | 56 | 61 | 64 | 68 | 69 | 76 | 78 | 86 |
| 8 | 7 | 8 | 16 | 24 | 40 | 46 | 54 | 75 | 85 | 97 | 111 |
| 9 | 14 | 28 | 37 | 49 | 52 | 53 | 65 | 70 | 80 | 86 | 88 |
| 10 | 12 | 31 | 36 | 51 | 53 | 56 | 74 | 82 | 100 | 119 | 121 |
| 11 | 7 | 8 | 9 | 17 | 28 | 38 | 48 | 58 | 71 | 86 | 92 |
| 12 | 4 | 11 | 14 | 16 | 18 | 20 | 27 | 29 | 33 | 43 | 72 |
| 13 | 1 | 2 | 21 | 23 | 25 | 47 | 68 | 72 | 74 | 75 | 77 |
| 14 | 1 | 21 | 32 | 54 | 59 | 66 | 80 | 81 | 89 | 94 | 97 |
| 15 | 5 | 12 | 57 | 67 | 70 | 88 | 93 | 102 | 122 | 130 | 131 |
| 16 | 2 | 3 | 13 | 42 | 49 | 62 | 64 | 69 | 72 | 77 | 80 |
| 17 | 2 | 30 | 32 | 35 | 43 | 50 | 52 | 68 | 79 | 81 | 84 |
| 18 | 3 | 8 | 10 | 26 | 49 | 54 | 55 | 58 | 61 | 63 | 65 |
| 19 | 1 | 7 | 17 | 21 | 22 | 25 | 33 | 38 | 53 | 60 | 67 |
| 20 | 6 | 22 | 26 | 28 | 29 | 41 | 45 | 51 | 61 | 62 | 77 |
| 21 | 13 | 77 | 80 | 103 | 105 | 106 | 108 | 109 | 121 | 127 | 138 |
| 22 | 3 | 5 | 15 | 26 | 38 | 42 | 48 | 51 | 71 | 78 | 82 |
| 23 | 3 | 6 | 14 | 16 | 21 | 22 | 24 | 28 | 29 | 37 | 40 |
| 24 | 4 | 13 | 15 | 20 | 33 | 35 | 38 | 57 | 67 | 81 | 90 |
| 25 | 2 | 6 | 11 | 13 | 18 | 23 | 24 | 31 | 34 | 37 | 41 |
| 26 | 7 | 10 | 39 | 41 | 47 | 60 | 61 | 63 | 69 | 83 | 84 |
| 27 | 18 | 19 | 25 | 27 | 31 | 37 | 59 | 61 | 69 | 84 | 98 |
| 28 | 3 | 12 | 17 | 24 | 40 | 53 | 60 | 64 | 71 | 75 | 79 |
| 29 | 3 | 5 | 17 | 23 | 40 | 43 | 53 | 55 | 56 | 61 | 63 |
| 30 | 5 | 6 | 12 | 27 | 29 | 30 | 33 | 36 | 37 | 42 | 43 |
| 31 | 9 | 11 | 16 | 25 | 32 | 39 | 44 | 49 | 55 | 70 | 87 |
| 32 | 4 | 8 | 17 | 22 | 27 | 35 | 48 | 50 | 54 | 71 | 74 |
| 33 | 6 | 10 | 18 | 19 | 20 | 45 | 56 | 84 | 85 | 99 | 105 |
| 34 | 14 | 15 | 23 | 29 | 32 | 47 | 65 | 71 | 74 | 76 | 85 |
| 35 | 6 | 10 | 13 | 18 | 36 | 41 | 42 | 46 | 48 | 57 | 68 |
| 36 | 8 | 12 | 30 | 34 | 38 | 41 | 50 | 54 | 70 | 71 | 78 |
| 37 | 5 | 16 | 31 | 34 | 45 | 50 | 51 | 59 | 62 | 63 | 73 |
| 38 | 8 | 20 | 32 | 37 | 39 | 69 | 72 | 77 | 82 | 83 | 89 |
| 39 | 14 | 17 | 19 | 42 | 44 | 45 | 50 | 52 | 57 | 67 | 74 |
| 40 | 2 | 9 | 15 | 30 | 35 | 41 | 45 | 60 | 62 | 73 | 75 |
| 41 | 1 | 4 | 18 | 36 | 39 | 57 | 62 | 64 | 66 | 70 | 73 |
| 42 | 1 | 20 | 38 | 51 | 62 | 76 | 78 | 94 | 100 | 105 | 106 |
| 43 | 9 | 12 | 28 | 58 | 59 | 77 | 83 | 91 | 94 | 103 | 106 |
| 44 | 11 | 25 | 33 | 39 | 42 | 53 | 60 | 87 | 88 | 102 | 104 |
| 45 | 33 | 34 | 45 | 63 | 64 | 66 | 82 | 115 | 117 | 119 | 124 |
| 46 | 11 | 13 | 40 | 43 | 48 | 49 | 52 | 55 | 63 | 73 | 83 |
| 47 | 10 | 31 | 43 | 44 | 50 | 59 | 66 | 67 | 68 | 73 | 76 |
| 48 | 7 | 19 | 21 | 22 | 35 | 46 | 48 | 78 | 83 | 85 | 107 |
| 49 | 7 | 14 | 16 | 31 | 44 | 58 | 60 | 67 | 86 | 89 | 96 |
The next step is to calculate sum of all values in each Level column:
| Level 0 | Level 1 | Level 2 | Level 3 | Level 4 | Level 5 | Level 6 | Level 7 | Level 8 | Level 9 | Level 10 | |
| Sum | 363 | 758 | 1213 | 1653 | 1996 | 2404 | 2734 | 3163 | 3488 | 3864 | 4214 |
The table above shows Summary History values for the latest of the selected draws which is 2010/28 Sun 1st.
What happens after adding winning numbers from the next draw 2010/28 Sun 2nd to the Number History table above? Winning numbers for that draw are 23-29-36-42-44-47-[7].
| Number | Level 0 | Level 1 | Level 2 | Level 3 | Level 4 | Level 5 | Level 6 | Level 7 | Level 8 | Level 9 | Level 10 |
| 1 | 5 | 16 | 20 | 21 | 30 | 36 | 37 | 67 | 70 | 92 | 98 |
| 2 | 3 | 6 | 23 | 31 | 33 | 45 | 47 | 58 | 60 | 73 | 80 |
| 3 | 22 | 24 | 26 | 27 | 28 | 29 | 35 | 37 | 40 | 41 | 57 |
| 4 | 11 | 24 | 25 | 31 | 48 | 50 | 67 | 89 | 97 | 103 | 122 |
| 5 | 10 | 12 | 20 | 27 | 45 | 48 | 53 | 56 | 59 | 80 | 81 |
| 6 | 2 | 5 | 10 | 16 | 27 | 47 | 53 | 65 | 74 | 76 | 93 |
| 7 | 25 | 28 | 35 | 57 | 62 | 65 | 69 | 70 | 77 | 79 | 87 |
| 8 | 8 | 9 | 17 | 25 | 41 | 47 | 55 | 76 | 86 | 98 | 112 |
| 9 | 15 | 29 | 38 | 50 | 53 | 54 | 66 | 71 | 81 | 87 | 89 |
| 10 | 13 | 32 | 37 | 52 | 54 | 57 | 75 | 83 | 101 | 120 | 122 |
| 11 | 8 | 9 | 10 | 18 | 29 | 39 | 49 | 59 | 72 | 87 | 93 |
| 12 | 5 | 12 | 15 | 17 | 19 | 21 | 28 | 30 | 34 | 44 | 73 |
| 13 | 2 | 3 | 22 | 24 | 26 | 48 | 69 | 73 | 75 | 76 | 78 |
| 14 | 2 | 22 | 33 | 55 | 60 | 67 | 81 | 82 | 90 | 95 | 98 |
| 15 | 6 | 13 | 58 | 68 | 71 | 89 | 94 | 103 | 123 | 131 | 132 |
| 16 | 3 | 4 | 14 | 43 | 50 | 63 | 65 | 70 | 73 | 78 | 81 |
| 17 | 3 | 31 | 33 | 36 | 44 | 51 | 53 | 69 | 80 | 82 | 85 |
| 18 | 4 | 9 | 11 | 27 | 50 | 55 | 56 | 59 | 62 | 64 | 66 |
| 19 | 2 | 8 | 18 | 22 | 23 | 26 | 34 | 39 | 54 | 61 | 68 |
| 20 | 7 | 23 | 27 | 29 | 30 | 42 | 46 | 52 | 62 | 63 | 78 |
| 21 | 14 | 78 | 81 | 104 | 106 | 107 | 109 | 110 | 122 | 128 | 139 |
| 22 | 4 | 6 | 16 | 27 | 39 | 43 | 49 | 52 | 72 | 79 | 83 |
| 23 | 1 | 4 | 7 | 15 | 17 | 22 | 23 | 25 | 29 | 30 | 38 |
| 24 | 5 | 14 | 16 | 21 | 34 | 36 | 39 | 58 | 68 | 82 | 91 |
| 25 | 3 | 7 | 12 | 14 | 19 | 24 | 25 | 32 | 35 | 38 | 42 |
| 26 | 8 | 11 | 40 | 42 | 48 | 61 | 62 | 64 | 70 | 84 | 85 |
| 27 | 19 | 20 | 26 | 28 | 32 | 38 | 60 | 62 | 70 | 85 | 99 |
| 28 | 4 | 13 | 18 | 25 | 41 | 54 | 61 | 65 | 72 | 76 | 80 |
| 29 | 1 | 4 | 6 | 18 | 24 | 41 | 44 | 54 | 56 | 57 | 62 |
| 30 | 6 | 7 | 13 | 28 | 30 | 31 | 34 | 37 | 38 | 43 | 44 |
| 31 | 10 | 12 | 17 | 26 | 33 | 40 | 45 | 50 | 56 | 71 | 88 |
| 32 | 5 | 9 | 18 | 23 | 28 | 36 | 49 | 51 | 55 | 72 | 75 |
| 33 | 7 | 11 | 19 | 20 | 21 | 46 | 57 | 85 | 86 | 100 | 106 |
| 34 | 15 | 16 | 24 | 30 | 33 | 48 | 66 | 72 | 75 | 77 | 86 |
| 35 | 7 | 11 | 14 | 19 | 37 | 42 | 43 | 47 | 49 | 58 | 69 |
| 36 | 1 | 9 | 13 | 31 | 35 | 39 | 42 | 51 | 55 | 71 | 72 |
| 37 | 6 | 17 | 32 | 35 | 46 | 51 | 52 | 60 | 63 | 64 | 74 |
| 38 | 9 | 21 | 33 | 38 | 40 | 70 | 73 | 78 | 83 | 84 | 90 |
| 39 | 15 | 18 | 20 | 43 | 45 | 46 | 51 | 53 | 58 | 68 | 75 |
| 40 | 3 | 10 | 16 | 31 | 36 | 42 | 46 | 61 | 63 | 74 | 76 |
| 41 | 2 | 5 | 19 | 37 | 40 | 58 | 63 | 65 | 67 | 71 | 74 |
| 42 | 1 | 2 | 21 | 39 | 52 | 63 | 77 | 79 | 95 | 101 | 106 |
| 43 | 10 | 13 | 29 | 59 | 60 | 78 | 84 | 92 | 95 | 104 | 107 |
| 44 | 1 | 12 | 26 | 34 | 40 | 43 | 54 | 61 | 88 | 89 | 103 |
| 45 | 34 | 35 | 46 | 64 | 65 | 67 | 83 | 116 | 118 | 120 | 125 |
| 46 | 12 | 14 | 41 | 44 | 49 | 50 | 53 | 56 | 64 | 74 | 84 |
| 47 | 1 | 11 | 32 | 44 | 45 | 51 | 60 | 67 | 68 | 69 | 74 |
| 48 | 8 | 20 | 22 | 23 | 36 | 47 | 49 | 79 | 84 | 86 | 108 |
| 49 | 8 | 15 | 17 | 32 | 45 | 59 | 61 | 68 | 87 | 90 | 97 |
From the table above you can see that the value in Level 0 for all winning numbers is 1. Value in Level 1 is previous value in Level 0 + 1, value in Level 2 is previous value in Level 1 + 1, value in Level 3 is previous value from Level 2 + 1.
Number History for all other pool numbers is simply the previous value incremented by 1.
The new History Summary is then:
| Level 0 | Level 1 | Level 2 | Level 3 | Level 4 | Level 5 | Level 6 | Level 7 | Level 8 | Level 9 | Level 10 | |
| Sum | 376 | 744 | 1186 | 1670 | 1999 | 2412 | 2746 | 3158 | 3511 | 3875 | 4245 |
When compared to previous draw the Summary History values have changed this way:
| Level 0 | Level 1 | Level 2 | Level 3 | Level 4 | Level 5 | Level 6 | Level 7 | Level 8 | Level 9 | Level 10 | |
| Previous sums (2010/28 Sun 1st) | 363 | 758 | 1213 | 1653 | 1996 | 2404 | 2734 | 3163 | 3488 | 3864 | 4214 |
| Latest sums (2010/28 Sun 2nd) | 376 | 744 | 1186 | 1670 | 1999 | 2412 | 2746 | 3158 | 3511 | 3875 | 4245 |
| Difference | +13 | -14 | -27 | +17 | +3 | +8 | +12 | -5 | +23 | +11 | +31 |
Now let's pretend that we don't know the actual winning numbers from the latest draw 2010/28 Sun 2nd but that we can correctly estimate how History Summary values will change after that draw. From the table above we can see that summary value in Level 0 will increase by 13, Level 1 will decrease by -14 etc. We will use a range of +10/-10 for each estimated value to allow for errors in our estimates. So the estimate for Level 0 is that the Summary History value will increase from +3 to +23 (the actual change in Level 0 is +13 so the range is +13-10=+3 and +13+10=23). Estimated range of changes in Level 1 is -24 to -4 (the actual change in Level 1 is -14 so the range is -14-10=-24 and -14+10=-4). The same applies to other Levels. Now we can use these estimates in Expert Lotto filters to find the Jackpot winning ticket:
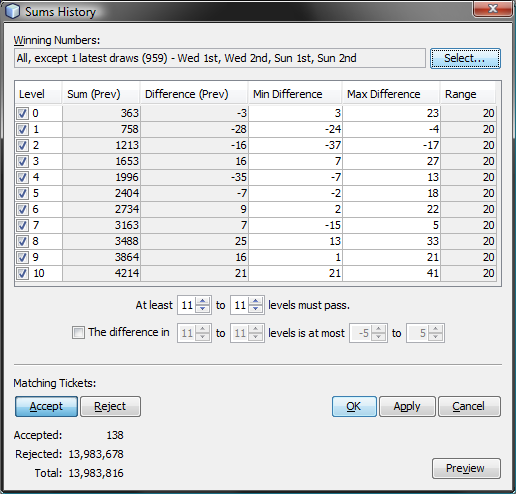
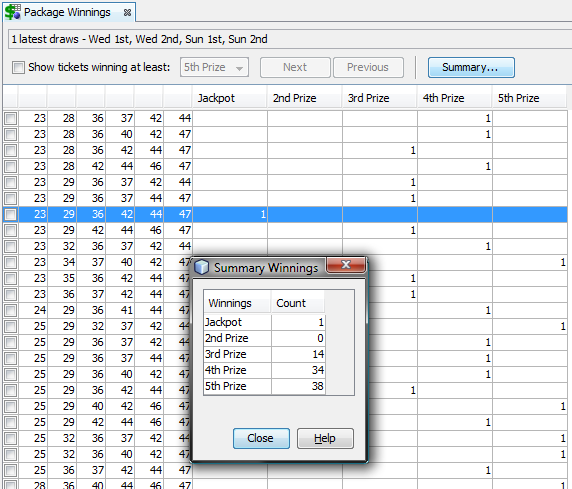
As you can see above, with History features you can reduce millions of number combinations down to a hundred or two hundred tickets while having 100% guarantee that the filtered tickets include the Jackpot winning one. However the problem is that it isn't easy to make correct estimates for all Levels. If a single Level value is out of the estimated range, the Jackpot ticket is lost. But here are various strategies to compensate for possible errors in estimated ranges.
Latest History window shows the history of numbers in the main pool for the selected past winning numbers draws. The window opens from menu History - Latest.
The field at the top of the window shows the past draws the Number History is calculated from. Click Select button to select a different part of winning numbers database for the Latest History window.
![]() You can open multiple Latest History windows - right-click the window header and select Clone Document from its popup menu.
You can open multiple Latest History windows - right-click the window header and select Clone Document from its popup menu.
The actual latest History is presented in two forms - Number History and Segmentation. Click buttons at the top left corner of the window to switch between Number History and Segmentation tables.
This table shows how many draws elapsed since the eleven latest occurrences of each number in the pool. The historical occurrences are called Levels. Level 0 represents the very latest occurrence of each number, Level 1 corresponds to previous occurrence of each number etc. The count of levels is adjustable in History settings.
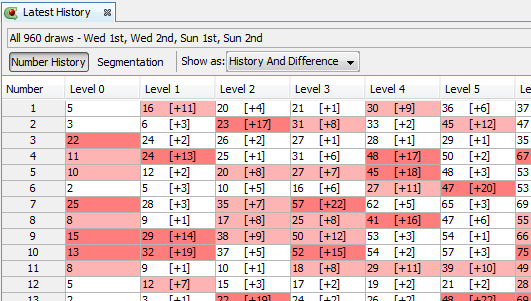
The screen shot above shows Number History of Expert Lotto 6/49 demo
lottery. From the table you can see that the latest occurrence of
number 1 happened 5 draws ago. The second latest occurrence of number 1
happened 16 draws ago, that's a difference of 11 draws since the very
latest occurrence as given in square brackets. The third latest
occurrence of number 1 was 20 draws ago which is a difference of 4
draws from the second latest occurrence of that number. The same
applies for other pool numbers and other Levels.
You can use Show as combo box to change the table format to show:
Note: In case of Level 0 the History value and the Difference value are the same as there's no previous Level to compare the History value with. History/Difference value 1 in Level 0 means that the given number hit in the very latest draw.
The difference value is very important as it divides the whole number pool into several segments:
Note: You can customize the Segments in History settings.
The segmentation of pool numbers is different for each History Level because the Difference values of a given pool number differ in each Level. See also the Segmentation table description below.
![]() Hover mouse cursor over table header to show the count of numbers from each History segment in given Level. For example tooltip in table column for Level 1 showing
Hover mouse cursor over table header to show the count of numbers from each History segment in given Level. For example tooltip in table column for Level 1 showing
29, diff sum: 73
13, diff sum: 121
7, diff sum: 174
means that there are 29 numbers in Level 1 with the differences from 1 to 6 and the sum of their differences is 73, 13 numbers with the differences from 7 to 12 with total sum of differences 121 and 7 numbers with the differences 13 and higher and their sum of differences is 174.
![]() Click column header of any Level to sort the Number
History table in ascending or descending order.
Click column header of any Level to sort the Number
History table in ascending or descending order.
![]() Ticket filters History Number Differences and History Number
Differences + Odd/Even are based the Differences of pool numbers.
Ticket filters History Number Differences and History Number
Differences + Odd/Even are based the Differences of pool numbers.
The sum of all History values for each Level column is available at
the bottom of this Number History table. The very last row in this
table, labeled What If, shows how Summary History values would change
if
given numbers were drawn:
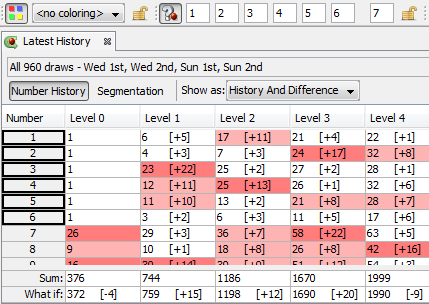
The screen shot above shows that the latest Sum History in Level 0 is 376 (in Expert Lotto 6/49 demo lottery). If numbers 1-2-3-4-5-6-[7] were drawn in the next draw then the Sum History in Level 0 would change to 372, which a difference of -4 when compared to the current latest draw. Sum History in Level 1 would change from 744 to 759, which is a difference of +15 etc.
Naturally, you can enter your own numbers into What If toolbar or use e.g. tickets in the Package as What If numbers, read more here. Note that current What If numbers are highlighted with black border in Number column and that the whole Number History table is recalculated as if the highlighted numbers were actually drawn.
Segmentation table shows Number History differences values. The first table column lists all History differences found in a given level while table rows list all pool numbers with the given History difference.
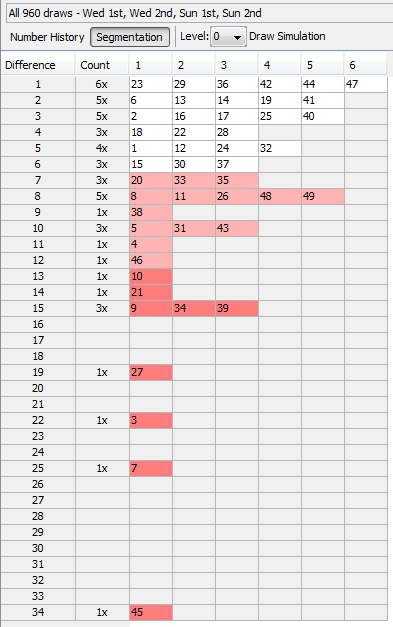
![]() When playing e.g. 6/xx lottery you can use your mouse to select six table cells (i.e. six pool numbers) and then click
When playing e.g. 6/xx lottery you can use your mouse to select six table cells (i.e. six pool numbers) and then click ![]() button in the toolbar to add the selected numbers as a new ticket into the Package.
button in the toolbar to add the selected numbers as a new ticket into the Package.
From the picture above you can see that History difference value 1 applies to pool numbers 23, 29, 36, 42, 44, 47, which are the winning numbers for the latest draw. Second table row lists 5 numbers with History difference of 2, they are 6, 13, 14, 19, 41. The same applies to other table rows. There is only one number - 45 - with the highest History difference value of 34.
Note that background color separates pool numbers into appropriate Segments according to their History differences. These colors are also automatically available in Number Coloring toolbar.
![]() Current What If numbers are highlighted with black border in the Segmentation table.
Current What If numbers are highlighted with black border in the Segmentation table.
![]() Hovering mouse cursor in Count column shows a tooltip describing the count of numbers in given Segment, the average History difference value and the sum of all History differences in the segment.
Hovering mouse cursor in Count column shows a tooltip describing the count of numbers in given Segment, the average History difference value and the sum of all History differences in the segment.
Status bar at the bottom of the window shows the minimum and maximum possible Summary History difference for current Level and the total count of numbers in each History segment:
Use Level combo box to see Segmentation table for other History Levels.
![]() See also History Level Synchronization.
See also History Level Synchronization.
Button Draw Simulation toggles draw simulation pane where you can run several test draws and see summary statistics of changes in History values.
See also Summary History and My Estimates.
This window opens from menu History - Summary.
The field at the top of the window shows the past draws the Summary History is calculated from. Click Select button to select a different part of winning numbers database for the Summary History window.
You can open multiple Summary History windows
- right-click
the window header and select Clone Document from its popup menu.
You can change the layout of split windows using menu View - Split orientation.
Summary History window presents its data in several forms, see below. Click buttons at the top-left corner of the window to switch its content.
Sums table shows History Sums and Differences for selected past draws. The table has the following columns:
| Date | Level 0 | Level 1 | Level 2 | Level 3 | Level 4 | Level 5 | Level 6 | Level 7 | Level 8 | Level 9 | Level 10 |
| 2010/28 Sun 1st | 363 [-3] | 758 [-28] | 1213 [-16] | 1653 [+16] | 1996 [-35] | 2404 [-7] | 2734 [+9] | 3163 [+7] | 3488 [+25] | 3864 [+16] | 4214 [+21] |
| 2010/28 Sun 2nd | 376 [+13] | 744 [-14] | 1186 [-27] | 1670 [+17] | 1999 [+3] | 2412 [+8] | 2746 [+12] | 3158 [-5] | 3511 [+23] | 3875 [+11] | 4245 [+31] |
![]() Click Date column header to change the order of draws in the
table. You can also resize column headers by dragging their borders.
Click Date column header to change the order of draws in the
table. You can also resize column headers by dragging their borders.
Button  at the top of the
window highlights Level table cells containing negative differences with red background,
positive differences are
highlighted with blue background.
at the top of the
window highlights Level table cells containing negative differences with red background,
positive differences are
highlighted with blue background.
Button Details toggles Number History and Segmentation details for selected table row. See Latest History window for detailed description. Note that winning numbers from the following draw are highlighted with black border.
Use menu History - Predictions to run automated predictions.
Segmentation table shows segment combinations for selected past draws.
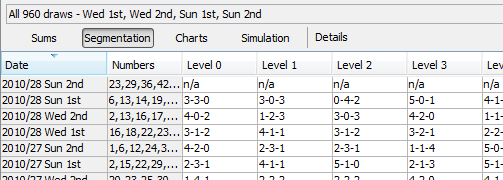
For example Level 0 for draw 2010/28 Sun 1st shows segment combination 3-3-0. That means 3 numbers from the following draw 2010/28 Sun 2nd are in Segment 1, they are numbers 23, 29 and 42. Three numbers - 36, 44 and 47 - are from Segment 2. Segment 3 for draw 2010/28 Sun 1st has none of the winning numbers of the following draw. Use button Details to see the actual number differences for given draw date.
There are no segmentation values for the latest draw as the winning numbers of the following draw are not available yet.
Button Details toggles Number History and Segmentation details for selected table row. See Latest History window for detailed description. Note that winning numbers from the following draw are highlighted with black border.
See also Segment Combinations History ticket filter.
The charts show the evolution of History values for selected draws. The charts display History Sum values, History Difference and Segmentation data for a given Level. Use Show combo box to switch the chart type. Level combo box changes the current History Level.
You can customize the charts using buttons at the top of the window.
![]() If you prefer visual perception of History data you can
estimate the future History ranges in Sum or Differences charts
conveniently:
If you prefer visual perception of History data you can
estimate the future History ranges in Sum or Differences charts
conveniently:
to show chart range tool. at the top of My Estimates window to display sum values instead of differences.
 to enter the estimated range into
the fields in My Estimates window.
to enter the estimated range into
the fields in My Estimates window. at the top of My Estimates window to find which tickets in the Package
fit into your estimated ranges or drag and drop that button into a
Complex Filter window.
at the top of My Estimates window to find which tickets in the Package
fit into your estimated ranges or drag and drop that button into a
Complex Filter window.The same steps apply for range estimates in Differences chart.
![]() Click into the chart to highlight the draw nearest to mouse cursor. The selected draw will then show in Ticket Properties and Ticket Panel windows respectively.
Click into the chart to highlight the draw nearest to mouse cursor. The selected draw will then show in Ticket Properties and Ticket Panel windows respectively.
![]() See also History Level Synchronization.
See also History Level Synchronization.
Click button  to run draw simulation.
My Estimates window tracks your estimated ranges for History values for the coming draw. It also provides various hints to make your estimates more precise. The window opens from menu History - My Estimates.
The estimates are organized into a table where each row represents a single History Level. Column Min shows the lower boundary of your estimate in a given Level. Column Max shows the upper bound of your estimate. You can enter estimated ranges directly from keyboard or use spinner buttons to increase or decrease Min/Max values by one. Column Range shows the estimated range in a given Level.
The first table column is a check box to turn corresponding Level on
or off. When a Level is turned off it won't be used when filtering
tickets in Sum Range ticket filter. Use this switch when you are not
sure how to estimate the History values in one or more Levels. Turning
a Level off does increase the count tickets left after filtering but
it's probably better than loosing the Jackpot ticket due to a wrong
estimate.
To turn multiple Levels on/off with a single click, first select
appropriate table rows with your mouse and then click check box column
of any selected row.
The last table column serves for Level locking. When a Level is
locked it isn't possible to make changes in its estimated range. Lock a
Level when you are done with estimating its range for the next draw. It
will prevent accidental changes when working with various hints at the
lower part of the window.
To lock/unlock multiple Levels with a single click, first select
appropriate table rows with your mouse and then click the last column
of any selected row.
My Estimates window remembers its last used values and restores them in a new application session.
Toolbar at the top of the window provides the following functions:
 - show estimated values as
differences from the latest sum values. - show estimated values as
absolute sums. - opens a popup menu where you
select hint whose values will be used in all Levels. If a Level is
locked (see above) then its estimated range will not change. - resets estimates in selected
Levels to zero.
- show estimated values as
differences from the latest sum values. - show estimated values as
absolute sums. - opens a popup menu where you
select hint whose values will be used in all Levels. If a Level is
locked (see above) then its estimated range will not change. - resets estimates in selected
Levels to zero. - finds the minimum and the
maximum possible ranges, see Absolute Ranges
below. - filters tickets in the Package
using current estimates. You can also drag and drop this button into
Complex Filter window.
- finds the minimum and the
maximum possible ranges, see Absolute Ranges
below. - filters tickets in the Package
using current estimates. You can also drag and drop this button into
Complex Filter window.Note: My Estimates window operates with the selection of past draws from the last active Latest History or Summary History windows. So if you select for example 10 latest draws in Latest History window and then switch to My Estimates window, the latest sum values in My Estimates will be calculated from the 10 latest draws.
The lower part of My Estimates window provides various hints you can
use when adjusting your estimates. Select a single row in the upper
table to see hints for corresponding Level. Initially the estimates are
empty, their Min and Max values just show n/a. You have to use some
other History features first to generate the estimates. Click button to use the hint values as your
estimates for selected Level. This button is disabled if the hint does
not have any value yet or when the selected Level is locked.
![]() Click the estimate name or the little expand button before the
name to see detailed information provided by the hint.
Click the estimate name or the little expand button before the
name to see detailed information provided by the hint.
The hint provides the minimum and maximum possible value as
calculated
in Lookup Min/Max Ranges window.
The hint details show the tickets and
the selection of past draws the min/max values were calculated from.
Click button ![]() in the toolbar at the top of the window to
recalculate absolute ranges.
in the toolbar at the top of the window to
recalculate absolute ranges.
Open Sums Chart in History Summary window and use Range Tool to
highlight a portion of the chart. The selected sum range will be then
available in this hint.
The hint details show average and median sum values from appropriate chart window.
Open Differences Chart in History Summary window and use Range Tool to
highlight a portion of the chart. The selected range of History differences will be then
available in this hint.
The hint details show average and median sum values from appropriate chart window.
Open Latest History window, switch to Segmentation mode and run draw simulation.
The default hint values are the minimum and the maximum from simulation
results. However since such ranges are usually too wide for reasonable
filtering (depending on the nature of tickets used for draw simulation)
you can fine tune this estimate by zooming a section of histogram chart
in simulation results window. The zoomed range will be used as new hint
values then.
The hint details show the average and median simulated sum and also the
tickets and segmentation settings that were used to simulate draws.
Open Summary History window, switch to Simulation mode and run draw simulation.
The default hint values are the minimum and the maximum from simulation
results. However since such ranges are usually too wide for reasonable
filtering (depending on the nature of tickets used for draw simulation)
you can fine tune this estimate by zooming a section of histogram chart
in simulation results window. The zoomed range will be used as new hint
values then.
The hint details show the average and median simulated sum and also the
tickets and ticket filter (if any) that were used to simulate draws.
Predictions [sums] & Prediction [differences]
Select menu History - Predictions to run automated prediction of upcoming History values. The predicted values are adjusted by adding/subtracting the predefined range from History settings. Hint details show additional information about the predicted value.
This hint provides History values produced by current What If numbers. Hint's range is adjustable in History settings.
The hint details show the current What If numbers.
This shows the result of draw simulation based on History ranges in selected levels. A histogram of simulation results is also available in History charts.
The hint details show the average and median simulated sum, filtering conditions and how many simulated draws passed that condition.
![]() You should always compare all hints witch each other when
estimating History values for the next draw. For example if Differences
Chart hint shows range -15 to +5 and Sums Chart hint shows range +12 to
+32 then it is clear that one of the estimates you made in Sums Chart or
Differences Chart is wrong. You should revisit the charts, make new
estimates and/or consult other hints. Alternatively, you can turn the
given Level off if it isn't possible to make a solid estimate.
You should always compare all hints witch each other when
estimating History values for the next draw. For example if Differences
Chart hint shows range -15 to +5 and Sums Chart hint shows range +12 to
+32 then it is clear that one of the estimates you made in Sums Chart or
Differences Chart is wrong. You should revisit the charts, make new
estimates and/or consult other hints. Alternatively, you can turn the
given Level off if it isn't possible to make a solid estimate.
![]() It is possible
to paste estimated ranges values from system clipboard. If you have
prepared your estimates in e.g. MS Excel, you can highlight two rows or
two columns of cells, copy them into system clipboard, click into My Estimates table and paste them as your new estimates. If My Estimates
is showing differences (see toolbar description above) then the pasted
values are interpreted also as differences, otherwise the pasted values
are treated as absolute sum values.
It is possible
to paste estimated ranges values from system clipboard. If you have
prepared your estimates in e.g. MS Excel, you can highlight two rows or
two columns of cells, copy them into system clipboard, click into My Estimates table and paste them as your new estimates. If My Estimates
is showing differences (see toolbar description above) then the pasted
values are interpreted also as differences, otherwise the pasted values
are treated as absolute sum values.
You can also highlight a single row in Summary History window, copy it to system clipboard and then paste it into My Estimates window in the same way. The values will be pasted both to Min and Max fields respectively.
![]() See also History Level Synchronization.
See also History Level Synchronization.
The goal of all lottery strategies is the prediction of winning numbers that will hit in the next draw. Lottery players in most cases search for the most frequent or the least frequent numbers, then examine the latest winning numbers and/or their statistical properties trying to guess what is the most likely to happen in the next draw.
Expert Lotto has built-in tool which automates the prediction process to some extent. The application will search through selected past draws and compare them with the latest winning numbers to predict the numbers and statistical properties that are expected in the coming draw. As all other Expert Lotto features, the predictions are based on solid math. With the same input data and the same settings the predictor will always provide the same, reproducible results. There is no magical black-box spitting out different numbers each time it is clicked. Expert Lotto predictor is based on pattern matching algorithm which is widely used in many other computer-assisted fields – facial recognition, statistical data analysis, signal processing etc.
The following table lists 15 latest draws in Expert Lotto 6/49 lottery in descending order:
| Date | Position 1 | Position 2 | Position 3 | Position 4 | Position 5 | Position 6 | Bonus |
| 2010/28 Sun 2nd | 23 | 29 | 36 | 42 | 44 | 47 | 7 |
| 2010/28 Sun 1st | 6 | 13 | 14 | 19 | 41 | 42 | 29 |
| 2010/28 Wed 2nd | 2 | 13 | 16 | 17 | 25 | 40 | 27 |
| 2010/28 Wed 1st | 16 | 18 | 22 | 23 | 28 | 29 | 24 |
| 2010/27 Sun 2nd | 1 | 6 | 12 | 24 | 32 | 41 | 44 |
| 2010/27 Sun 1st | 2 | 15 | 22 | 29 | 30 | 37 | 42 |
| 2010/27 Wed 2nd | 20 | 23 | 25 | 30 | 33 | 35 | 7 |
| 2010/27 Wed 1st | 8 | 11 | 19 | 26 | 48 | 49 | 18 |
| 2010/26 Sun 2nd | 8 | 11 | 18 | 32 | 36 | 38 | 6 |
| 2010/26 Sun 1st | 5 | 6 | 11 | 31 | 40 | 43 | 32 |
| 2010/26 Wed 2nd | 4 | 18 | 26 | 33 | 35 | 47 | 11 |
| 2010/26 Wed 1st | 5 | 12 | 25 | 31 | 44 | 46 | 33 |
| 2010/25 Sun 2nd | 10 | 15 | 28 | 30 | 36 | 43 | 35 |
| 2010/25 Sun 1st | 16 | 21 | 24 | 25 | 35 | 46 | 47 |
| 2010/25 Wed 2nd | 9 | 12 | 23 | 34 | 39 | 49 | 24 |
The latest three numbers at the second ticket position are: 13, 13 and 29. Those three numbers form the latest pattern. The pattern size is 3 as it consists of three numbers.
Now we will search the past winning numbers at the second ticket position and look for a similar pattern. The table above shows that the best matching past pattern can be found in draws 2010/26 Sun 2nd to 2010/27 Wed 2nd. The past winning numbers are 11, 11 and 23. The following draw is 2010/27 Sun 1st where the second winning number is 15. So the prediction for the coming draw 2010/29 Wed 1st is number 15 at the second ticket position.
Let's verify our prediction in Expert Lotto:
Winning Number Properties window opens and its table will show the following value in Position 2 column:
The downward red triangle indicates that the predicted trend is decrease in the next draw and the number predicted for the second ticket position is 15. See below for more instructions how to interpret the prediction results.
If we let the predictor scan the whole database of past winning numbers then it will find the best matching pattern in draws 2006/23 Sun 2nd to 2006/24 Wed 2nd. Their winning numbers are 12, 16 and 30. The following winning number at the second ticket position is 11. That means the predicted trend is again decrease and the predicted value is 11.
What happens if we increase the pattern size from three numbers to 10 numbers? The latest pattern is then 6,11,11,23,15,6,18,13,13,29. When displayed in a chart the numbers look like this:
The predictor will find best matching pattern in draws 2008/45 Sun 2nd to 2008/48 Wed 1st where the winning numbers are 9,20,13,21,12,8,15,15,4,27. The numbers in a chart look like this:
The following number at the second ticket position is again 11 (draw 2008/48 Wed 2nd). That means the predicted trend is again decrease and the predicted value is 11.
If you compare the chart of the latest pattern and the chart of the found matching pattern above, you can see that the match is actually very loose. But it is still the best match the predictor can find in the whole database of past winning numbers. We cannot realistically expect to find a sequence of past winning numbers that is exactly the same as the ten latest draws. The longer the patterns are the less similarities between the latest pattern and the best matching pattern. So how to select the optimal pattern size?
In the examples above we used pattern size 3 which gave us predicted value 11 and pattern size 10 also with predicted value 11. In this case we have the same results. But what if the predicted values or even the predicted trends were different? How to tell which prediction is more credible?
The predictor runs a series of tests and selects the best pattern size automatically. Option Latest draws for back-testing in prediction settings screen defines how deep this back-testing is. If the prediction settings are for example Pattern size min 3, max 15, Latest draws for back-testing: 10 then the predictor will make 130 predictions to pick the optimal pattern size. It will start with pattern size 3, make prediction for draw 2010/28 Sun 1st and compare the predicted trend with actual value from the following draw 2010/28 Sun 2nd. Then it will make prediction for draw 2010/28 Wed 2nd and compare the predicted trend with the value from the following draw 2010/28 Sun 1st. There will be 10 such testing predictions up to draw 2010/26 Wed 2nd. The predictor will count how many predicted trends were correct when compared with the following draws.
Then the pattern size will increase to four and the predictor will make another ten testing predictions for ten latest draws. The count of correct trend predictions is noted. The pattern size is increased to five and the testing runs are repeated. This continues up to pattern size 15 as selected in prediction settings. Then the predictor will select the pattern size that had the highest count of correct trend predictions. This optimal pattern size is then used to make the actual prediction for the latest draw 2010/28 Sun 2nd. In this case the best pattern size is 3 because seven trend predictions were correct during back-testing. When using pattern size 10, there were only 4 valid trend predictions out of the ten back-test runs.
![]() Hover mouse cursor above table cell with prediction result to see a tooltip with the best pattern size and the count of back-test predictions that were correct.
Hover mouse cursor above table cell with prediction result to see a tooltip with the best pattern size and the count of back-test predictions that were correct.
With option Back-testing compares values you can modify the prediction algorithm to select the pattern size that predicts values which are closest to the actual values when back-testing.
![]() Some lottery operators publish additional details about each draw – which set of balls has been used, which drawing machine etc. If the balls and/or machines are being changed at regular intervals it probably makes sense to use pattern sizes shorter than the interval between such changes.
Some lottery operators publish additional details about each draw – which set of balls has been used, which drawing machine etc. If the balls and/or machines are being changed at regular intervals it probably makes sense to use pattern sizes shorter than the interval between such changes.
The predictor has two modes of pattern matching. It can match either absolute values in a sequence of numbers as demonstrated above or it can match number differences instead. Let's have the following sequence of numbers:
31,35,13,20,15,5,2,10,4,25,3,10,5
Let's consider the last three numbers as the latest pattern: 3,10,5. When matching absolute values then the best matching pattern is 2,10,4 followed by number 45. However when matching number differences then the best matching pattern is 13,20,15 followed by number 5.
The same sequence of numbers expressed as value differences looks like this:
+31,+4,-22,+7,-5,-10,-3,+8,-6,+21,-22,+7,-5
So the latest pattern has changed to -22,+7,-5 and the best matching pattern is -22,+7,-5 corresponding to numbers 13,20,15 followed by number 5. So when matching differences the matching pattern must have the same shape (the order of increasing/decreasing values) as the latest pattern however all its values may be shifted up or down when compared with the latest pattern.
Now we will repeat the prediction for the second ticket number and use differences pattern matching instead of absolute values:
The best matching pattern are draws 2006/20 Wed 1st to 2006/20 Sun 1st with numbers 4,4,21, which translate to differences -3,0,+17. The following difference is -8.
The differences of the latest pattern are -5,0,+16. The predicted value is
29 – abs( -8 * (abs(-5/-3) + abs(0/0) + abs(16/17)) / 3 * ) = 29 – 9.62 = 19.
Note that the predicted value includes correction which takes into account the differences between the latest and best matching patterns.
The same prediction with pattern size 10 will find the best matching pattern at draws 2009/24 Wed 1st to 2009/26 Wed 2nd where the numbers are 5,15,15,20,13,10,14,9,6,11 and the following number is 21. The prediction is increase to 46. This prediction is conflicting with the prediction with pattern size 3. However this prediction is a bit less credible as the back-testing passed in 5 out of 10 back test runs, while pattern size 3 predictions had 6 valid trend predictions during back-testing.
![]() It is recommended to use differences pattern matching especially for predictions of derived values like History sums and differences. Absolute values pattern matching is suitable for values with a small range, for example sum root, odd/even or the actual winning numbers at individual ticket positions.
It is recommended to use differences pattern matching especially for predictions of derived values like History sums and differences. Absolute values pattern matching is suitable for values with a small range, for example sum root, odd/even or the actual winning numbers at individual ticket positions.
Pattern matching slider in Predictions Options window adjusts the weights of individual numbers when the patterns are being compared. When the slider is moved fully to the right then the pattern matching is strict and each number has the same weight.
Moving slider to the left relaxes the pattern matching as the numbers of the patterns being matched have lower weight when comparing them together. If the latest pattern is for example 6,11,11,23,15,6,18,13,13,29 then strict pattern matching may find for example pattern 9,20,13,21,12,8,15,15,4,27. With relaxed matching the best found pattern will be for example 33,16,25,14,31,11,18,12,16,30. As you can see the first few numbers of the best matching pattern match the latest pattern very loosely only. In both cases the predicted value is 10 however with relaxed pattern matching there were 9 valid back-test predictions while the strict matching produced only 7 valid predictions when back-testing on 15 latest draws. Relaxed pattern matching is recommend only when using larger pattern sizes (10 and more).
Predictions are available either from menu Winning Numbers – Predictions or from menu History – Predictions. Both menu commands start Predictions wizard.
You can track the progress of the prediction process at the lower right corner of the main window. When the process is finished the prediction results are available in Winning Numbers Properties and Winning Numbers Charts windows or in Summary History window under Sums and Charts tabs.
![]() – blue triangle indicates that the predicted trend is increase. That means the next value is expected to be greater than the latest value. The actual predicted value is also available.
– blue triangle indicates that the predicted trend is increase. That means the next value is expected to be greater than the latest value. The actual predicted value is also available.
![]() – red triangle indicates that the predicted trend is decrease. That means the next value is expected to be lower than the latest value.
– red triangle indicates that the predicted trend is decrease. That means the next value is expected to be lower than the latest value.
![]() – when both red and blue triangles are present in table cell then the predicted trend is level. That means the next value is expected to be the same as the latest value.
– when both red and blue triangles are present in table cell then the predicted trend is level. That means the next value is expected to be the same as the latest value.
Note: The predictions algorithm operates just with a sequence of numbers. In some cases the predicted value can be lower or higher than the minimum or maximum possible values. In such cases you should consider the predicted trend only.
Value n/a in prediction results means it was not possible to make valid prediction. Usually because there are not enough data to select the matching pattern.
![]() The predicted trend should be the main indicator when estimating values for the coming draw. The actual predicted value should be only a hint showing how big the predicted increase or decrease is.
The predicted trend should be the main indicator when estimating values for the coming draw. The actual predicted value should be only a hint showing how big the predicted increase or decrease is.
Hover mouse cursor over predicted cell to see a tooltip with additional information regarding the prediction. You can see how many back-test predictions were correct and the pattern size that has been used for predictions.
![]() It is recommended to ignore predictions with low percentage of successful back-test by entering required percentage of successful back-test into the last input field.
It is recommended to ignore predictions with low percentage of successful back-test by entering required percentage of successful back-test into the last input field.
Detailed information about the prediction process is available in Application Log. When the predictions are finished click menu View – Application Log. The Output window then shows the following details for each predicted value. For example:
Position 2 – name of the predicted value. In this case it is the winning number at the second ticket position.
Trend prediction: Decrease – predicted trend (increase/decrease/level)
Predicted value: 10.0 – the actual predicted value. Please note that all values are zero-based so the predicted winning number is 11.
Best pattern size: 5 – the pattern size used for the prediction.
Best weight: 1.0 – the weight used for pattern matching. The weight is always 1.0 unless relaxed pattern matching has been used.
Matching pattern: [10.0 17.0 11.0 15.0 29.0] => 10.0 – the best matching pattern found. In the case the best pattern are numbers 11,18,12,16,30. The number following this pattern is 11.
Marker: 94 – the position in the sequence of numbers where the best matching pattern has been found. Value 0 means the oldest draw.
Back-tests: 15 – the count of back tests that have been carried out to validate the pattern size.
Mean Square Error: 107.66666666666667 – shows how much the back-test prediction values differ from the actual values. The lower MSE the more accurate the back-test prediction values are.
Mean Absolute Percentage Error: 0.6399601052542229 - MAPE indicator also compares the back-test predictions with the actual values.
Valid trend predictions: 6 (40.0%) - how any back tests produced correct trend prediction.
See also Trend Predictions filter.
This filter accepts tickets that produce History sum differences in given range in selected History Levels.
To use the filter, first click Select button to choose past winning
numbers draws to calculate the History values from. Then tick History
Levels you wish to filter in the table below and enter the desired
minimum and maximum difference for each selected Level. Column Sum
(Prev) shows the History Sum values corresponding to the latest draw
from the selection of past winning numbers. Column Difference (Prev) is
History sum difference corresponding to the latest draw (History sum of
the latest draw minus the History sum value of the second latest draw
from the selection of past winning numbers). Column Range shows the
selected range of History values for given Level.
With option At least X to Y levels must pass you can specify the
minimum and maximum count of selected Levels that must have the History value in the given range to pass the whole filter.
Optional condition The difference in X to Y levels is at most
A to B makes the filter more strict by specifying the minimum and
maximum difference for several History Levels. Note: If the range
specified by values A and B is bigger than the ranges in all selected
Levels then this additional condition has no effect on filtering
results.
See also In Range Differences statistics.
![]() You can tick/untick multiple Levels with a single click -
select table rows you wish to modify using your mouse and then click
into the Level column of one of the selected rows.
You can tick/untick multiple Levels with a single click -
select table rows you wish to modify using your mouse and then click
into the Level column of one of the selected rows.
![]() You can increment or decrement differences in multiple table
cells using your keyboard - select table cells your wish to modify and
then press CTRL+up arrow key to increment values in all selected cell.
Press CTRL+down arrow key to decrement values in all selected cells.
You can increment or decrement differences in multiple table
cells using your keyboard - select table cells your wish to modify and
then press CTRL+up arrow key to increment values in all selected cell.
Press CTRL+down arrow key to decrement values in all selected cells.
![]() You can
paste the differences from system clipboard. For example highlight two
rows or two columns of cells in MS Excel, press CTRL+C to copy the highlighted values into system clipboard, click into the table in filter window and press CTRL+V to paste the values as new filter parameters. Pasting a single row or a single column of cells inserts the values into both Min and Max columns respectively.
You can
paste the differences from system clipboard. For example highlight two
rows or two columns of cells in MS Excel, press CTRL+C to copy the highlighted values into system clipboard, click into the table in filter window and press CTRL+V to paste the values as new filter parameters. Pasting a single row or a single column of cells inserts the values into both Min and Max columns respectively.
Note: When using this filter from My Estimates window, most of the filter settings are already preselected.
This filter accepts tickets that produce either odd or even History Sum values at selected Levels.
To use the filter first click Select button to choose past winning
numbers draws to calculate History values from. Then tick the Levels you wish to filter in the table below. Next tick either Odd Sum or
Even Sum column or both columns in selected Levels.
With option Odd sum count X to Y you can add another filtering
condition stating that a ticket is accepted only if it produces at
least X to Y odd sums in selected Levels.
![]() You can tick/untick multiple table cell with a single mouse
click - first select table rows you wish to modify with your mouse then
click into one of the selected cells.
You can tick/untick multiple table cell with a single mouse
click - first select table rows you wish to modify with your mouse then
click into one of the selected cells.
This filter accepts tickets that produce History differences whose standard deviation is in selected range. Low standard deviation values means that History differences in all Levels are very similar. High standard deviation values mean that History differences differ a lot from each other in all Levels.
When filter settings are Winning Numbers: 10 latest draws, Standard deviation min: 0.0, max 5.0 then:
This filter accepts tickets that have desired count of negative or positive History sum differences in selected Levels.
![]() You can tick/untick multiple Levels with a single mouse
click - first select table rows you wish to modify with your mouse then
click into one of the selected cells.
You can tick/untick multiple Levels with a single mouse
click - first select table rows you wish to modify with your mouse then
click into one of the selected cells.
When filter settings are Winning Numbers: 10 latest draws, Levels: 0, 1, 2, Negative differences count: 3 to 3, Positive differences count 3 to 3 then:
This filter accepts tickets that have desired count of unique History sum differences. A History value is unique if it doesn't repeat in any other Level.
When filter settings are Winning Numbers: 10 latest draws, The count of unique history differences: 11 to 11 then:
This filter accepts tickets with numbers that fall into selected segments in selected History Level.
To use the filter, first click Select button to choose past winning
numbers draws to calculate History values from. Then pick the Level you
wish to filter in Level combo box. Note: You can filter only one
History Level at a time. Next tick the segments you wish to use in the
filter in the table below and enter the minimum and maximum count of
ticket numbers each selected segment must have. Table on the right
shows the current distribution of pool numbers into History segments for selected Level.
Click Customize button to adjust segmentation settings for this filtering session.
Option At least X to Y segments must pass. allows to relax the filter condition by specifying how many selected segments must pass. For example with option At least 2 to 3 segments must pass the filter will also accept tickets whose numbers with into to two selected segments only.
This filter accepts tickets that have selected Segment Combinations at selected History Levels.
To use the filter, first click Select button to choose past winning
numbers draws to calculate History values from. Then tick the Levels you wish to filter in the table below. Next tick the Segment
Combinations that are required to appear in selected Levels.
With option At least X to Y levels must pass you can specify the
minimum and maximum count of selected Levels that must have one of the
selected Segment Combinations to pass the whole filter.
Click button Customize to adjust segmentation settings for the current filtering session.
![]() You can tick/untick multiple Levels or Segment Combinations with
a single mouse
click - first select table rows you wish to modify with your mouse then
click into one of the selected cells.
You can tick/untick multiple Levels or Segment Combinations with
a single mouse
click - first select table rows you wish to modify with your mouse then
click into one of the selected cells.
This filter accepts tickets with numbers that have History number differences within given range in selected Levels.
![]() You can tick/untick multiple Levels with a single mouse
click - first select table rows you wish to modify with your mouse then
click into one of the selected cells.
You can tick/untick multiple Levels with a single mouse
click - first select table rows you wish to modify with your mouse then
click into one of the selected cells.
When filter settings are Winning Numbers: 10 latest draws, Levels: 0, 1, 2, Number difference: 5 to 5, Total number count: 2 to 18, Number count in a single level: 0 to 6 then the filter accepts tickets that have at least two numbers with difference of 5 in Levels 0 to 2 in Number History table:
This filter is very similar to the plain History Number Differences filter except that it adds additional condition how many matching numbers must be odd/even.
When filter settings are Winning Numbers: 10 latest draws, Levels: 0, 1, 2, Number difference: 5 to 5, Total number count: 2 to 18, Odd number count: 0 to 18 then the filtering results are the same as when using History Number Differences with settings Winning Numbers: 10 latest draws, Levels: 0, 1, 2, Number difference: 5 to 5, Total number count: 2 to 18, Number count in a single level: 0 to 6.
When filter settings are Winning Numbers: 10 latest draws, Levels: 0, 1, 2, Number difference: 5 to 5, Total number count: 3 to 18, Odd number count: 3 to 3 then the filter accepts tickets that have at least 3 numbers with the History difference of 5 in Levels 0 to 2 in Number History table and exactly three of such numbers are odd:
This filter accepts tickets with numbers that have selected count of unique History number differences within in each selected Level. History difference of a ticket number is unique if no other number in the filtered ticket has the same History difference value. Optionally it is possible to specify the total count of such unique differences across all selected Levels.
![]() You can tick/untick multiple Levels with a single mouse
click - first select table rows you wish to modify with your mouse then
click into one of the selected cells.
You can tick/untick multiple Levels with a single mouse
click - first select table rows you wish to modify with your mouse then
click into one of the selected cells.
Click menu History - Latest to display the number History values for 10 latest draws. Switch Show as combo box to Differences Only and you will see that History differences in Level 0 are:
| Number | Level 0 | Level 1 | Level 2 | Level 3 | Level 4 | Level 5 | Level 6 | Level 7 | Level 8 | Level 9 | Level 10 |
| 23 | 1 | 3 | 3 | 8 | 2 | 5 | 1 | 2 | 4 | 1 | 8 |
| 29 | 1 | 3 | 2 | 12 | 6 | 17 | 3 | 10 | 2 | 1 | 5 |
| 36 | 1 | 8 | 4 | 18 | 4 | 4 | 3 | 9 | 4 | 16 | 1 |
| 42 | 1 | 1 | 19 | 18 | 13 | 11 | 14 | 2 | 16 | 6 | 5 |
| 44 | 1 | 11 | 14 | 8 | 6 | 3 | 11 | 7 | 27 | 1 | 14 |
| 47 | 1 | 10 | 21 | 12 | 1 | 6 | 9 | 7 | 1 | 1 | 5 |
| 6 | 2 | 3 | 5 | 6 | 11 | 20 | 6 | 12 | 9 | 2 | 17 |
| 13 | 2 | 1 | 19 | 2 | 2 | 22 | 21 | 4 | 2 | 1 | 2 |
| 14 | 2 | 20 | 11 | 22 | 5 | 7 | 14 | 1 | 8 | 5 | 3 |
| 19 | 2 | 6 | 10 | 4 | 1 | 3 | 8 | 5 | 15 | 7 | 7 |
| 41 | 2 | 3 | 14 | 18 | 3 | 18 | 5 | 2 | 2 | 4 | 3 |
| 2 | 3 | 3 | 17 | 8 | 2 | 12 | 2 | 11 | 2 | 13 | 7 |
| 16 | 3 | 1 | 10 | 29 | 7 | 13 | 2 | 5 | 3 | 5 | 3 |
| 17 | 3 | 28 | 2 | 3 | 8 | 7 | 2 | 16 | 11 | 2 | 3 |
| 25 | 3 | 4 | 5 | 2 | 5 | 5 | 1 | 7 | 3 | 3 | 4 |
| 40 | 3 | 7 | 6 | 15 | 5 | 6 | 4 | 15 | 2 | 11 | 2 |
| 18 | 4 | 5 | 2 | 16 | 23 | 5 | 1 | 3 | 3 | 2 | 2 |
| 22 | 4 | 2 | 10 | 11 | 12 | 4 | 6 | 3 | 20 | 7 | 4 |
| 28 | 4 | 9 | 5 | 7 | 16 | 13 | 7 | 4 | 7 | 4 | 4 |
| 1 | 5 | 11 | 4 | 1 | 9 | 6 | 1 | 30 | 3 | 22 | 6 |
| 12 | 5 | 7 | 3 | 2 | 2 | 2 | 7 | 2 | 4 | 10 | 29 |
| 24 | 5 | 9 | 2 | 5 | 13 | 2 | 3 | 19 | 10 | 14 | 9 |
| 32 | 5 | 4 | 9 | 5 | 5 | 8 | 13 | 2 | 4 | 17 | 3 |
| 15 | 6 | 7 | 45 | 10 | 3 | 18 | 5 | 9 | 20 | 8 | 1 |
| 30 | 6 | 1 | 6 | 15 | 2 | 1 | 3 | 3 | 1 | 5 | 1 |
| 37 | 6 | 11 | 15 | 3 | 11 | 5 | 1 | 8 | 3 | 1 | 10 |
| 20 | 7 | 16 | 4 | 2 | 1 | 12 | 4 | 6 | 10 | 1 | 15 |
| 33 | 7 | 4 | 8 | 1 | 1 | 25 | 11 | 28 | 1 | 14 | 6 |
| 35 | 7 | 4 | 3 | 5 | 18 | 5 | 1 | 4 | 2 | 9 | 11 |
| 8 | 8 | 1 | 8 | 8 | 16 | 6 | 8 | 21 | 10 | 12 | 14 |
| 11 | 8 | 1 | 1 | 8 | 11 | 10 | 10 | 10 | 13 | 15 | 6 |
| 26 | 8 | 3 | 29 | 2 | 6 | 13 | 1 | 2 | 6 | 14 | 1 |
| 48 | 8 | 12 | 2 | 1 | 13 | 11 | 2 | 30 | 5 | 2 | 22 |
| 49 | 8 | 7 | 2 | 15 | 13 | 14 | 2 | 7 | 19 | 3 | 7 |
| 38 | 9 | 12 | 12 | 5 | 2 | 30 | 3 | 5 | 5 | 1 | 6 |
| 5 | 10 | 2 | 8 | 7 | 18 | 3 | 5 | 3 | 3 | 21 | 1 |
| 31 | 10 | 2 | 5 | 9 | 7 | 7 | 5 | 5 | 6 | 15 | 17 |
| 43 | 10 | 3 | 16 | 30 | 1 | 18 | 6 | 8 | 3 | 9 | 3 |
| 4 | 11 | 13 | 1 | 6 | 17 | 2 | 17 | 22 | 8 | 6 | 19 |
| 46 | 12 | 2 | 27 | 3 | 5 | 1 | 3 | 3 | 8 | 10 | 10 |
| 10 | 13 | 19 | 5 | 15 | 2 | 3 | 18 | 8 | 18 | 19 | 2 |
| 21 | 14 | 64 | 3 | 23 | 2 | 1 | 2 | 1 | 12 | 6 | 11 |
| 9 | 15 | 14 | 9 | 12 | 3 | 1 | 12 | 5 | 10 | 6 | 2 |
| 34 | 15 | 1 | 8 | 6 | 3 | 15 | 18 | 6 | 3 | 2 | 9 |
| 39 | 15 | 3 | 2 | 23 | 2 | 1 | 5 | 2 | 5 | 10 | 7 |
| 27 | 19 | 1 | 6 | 2 | 4 | 6 | 22 | 2 | 8 | 15 | 14 |
| 3 | 22 | 2 | 2 | 1 | 1 | 1 | 6 | 2 | 3 | 1 | 16 |
| 7 | 25 | 3 | 7 | 22 | 5 | 3 | 4 | 1 | 7 | 2 | 8 |
| 45 | 34 | 1 | 11 | 18 | 1 | 2 | 16 | 33 | 2 | 2 | 5 |
Please note that the table above is sorted in ascending order by column Level 0.
When filter settings are Winning
Numbers: 10 latest draws, Levels: 0, Unique number differences in each Level 6 to 6, Total count of unique number differences 6 to 6, At least 1 to 1 Level must pass then each number in accepted tickets will have a different History difference in Level 0. Such a ticket is for example 01-02-03-04-05-06
Filter rejects for example ticket 01-02-03-04-06-13 because numbers 6 and 13 have the same History difference 2 in Level 0.
When filter settings are Winning Numbers: 10 latest draws, Levels: 0, Unique number differences in each Level 1 to 1, Total count of unique number differences 1 to 1, At least 1 to 1 Level must pass then each number in accepted tickets will have the same History difference in Level 0. Looking at the table above we can see there are only six numbers with the same difference in Level 0: 23-29-36-42-44-47. That means the latest winning numbers.
See also Unique Number Differences statistics.
This filter sums History differences of numbers in filtered tickets and accepts those tickets that have such a sum in given range in selected Levels.
![]() You can tick/untick multiple Levels with a single mouse
click - first select table rows you wish to modify with your mouse then
click into one of the selected cells..
You can tick/untick multiple Levels with a single mouse
click - first select table rows you wish to modify with your mouse then
click into one of the selected cells..
When filter settings are Winning Numbers: 10 latest draws, Levels: 0, 1, 2, Sum of number differences min: 10 max: 30, At least 3 to 3 levels must pass then:
When filter settings are Winning Numbers: 10 latest draws, Levels: 0, 1, 2, 3, 4, 5, 6, 7, 8, 9, 10, Sum of number differences min: 40 max: 50, At least 11 to 11 levels must pass then the filter will find just 4 tickets out of nearly 14 millions that have the sum of History number differences in the range of 40 to 50 in all 11 Levels.
See also Number Differences Sum statistical property.
The filter accepts tickets that have the same History sum value in selected Levels as selected past draw.
The History sums for the latest draw are:
| Level | History Sum |
| 0 | 376 |
| 1 | 744 |
| 2 | 1186 |
| 3 | 1670 |
| 4 | 1999 |
| 5 | 2412 |
| 6 | 2746 |
| 7 | 3158 |
| 8 | 3511 |
| 9 | 3875 |
| 10 | 4245 |
When filter settings are Winning Numbers: 1 latest draw, Levels 0 to 10, Match at least 6 to 11 levels then the filter will accept a single ticket 4-10-26-28-29-46. Its History sums are 376, 744, 1166, 1674, 1996, 2412, 2746, 3158, 3511, 3870, 4253. Six History sums are the same as in the selected latest draws.
See also Sums History filter.
The filter accepts tickets that have the same History difference value in selected Levels as selected past draw.
The History differences for the latest draw are:
| Level | History Sum |
| 0 | +13 |
| 1 | -14 |
| 2 | -27 |
| 3 | +17 |
| 4 | +3 |
| 5 | +8 |
| 6 | +12 |
| 7 | -5 |
| 8 | +23 |
| 9 | +11 |
| 10 | +31 |
When filter settings are Winning Numbers: 1 latest draw, Levels 0 to 10, Match at least 5 to 11 levels then the filter will accept only 5 tickets. One of them is for example ticket 7-13-18-26-31-41 with History differences -2, +32, -27, -20, +3, -19, +12, +32, +23, +11, +16 in Levels 0 to 10. Five History differences are the same as in the selected latest draw.
See also Match Past Sums filter and Sums History filter.
The filter accepts tickets that produce History sums in selected Levels lower or greater than the History sums in selected past draws.
For example the History sums of the latest draw in the demo Expert Lotto 6/49 lottery are 376, 744, 1186, 1670, 1999, 2412, 2746, 3158, 3511, 3875 and 4245 in Levels 0 to 11.
When the filter settings are Winning Numbers: 10 latest draws, Level 0: decrease, Level 1: decrease, Level 2: decrease, Level 3: decrease, Level 4: decrease, Level 5: decrease, Level 6: decrease, Level 7: decrease, Level 8: decrease, Level 9: decrease, Level 10: decrease, At least 11 to 11 levels must pass then the filter will select just 27 tickets from the full wheel. All these tickets will produce History sums lower than 376 in Level 0, lower than 744 in Level 1 etc.
See also History Sum Movement statistics and History Differences Movement filter.
The filter accepts tickets that produce History differences in selected Levels lower or greater than the History differences in selected past draws.
For example the History differences of the latest draw in the demo Expert Lotto 6/49 lottery are +13, -14, -27, +17, +3, +8, +12, -5, +23, +11 and +31 in Levels 0 to 11.
When the filter settings are Winning Numbers: 10 latest draws, Level 0: decrease, Level 1: decrease, Level 2: decrease, Level 3: decrease, Level 4: decrease, Level 5: decrease, Level 6: decrease, Level 7: decrease, Level 8: decrease, Level 9: decrease, Level 10: decrease, At least 11 to 11 levels must pass then the filter will select 475 tickets from the full wheel. All these tickets will produce History differences lower than 13 in Level 0, lower than -14 in Level 1 etc.
See also History Differences Movement statistics and History Sums Movement filter.
Negative and Positive History Differences statistics track how many analyzed draws/tickets produce negative and positive History sum differences in a given Level. The analyzer shows collected data in three ways - discrete values, values grouped by range of 5 and values grouped by range of 10.
For example 10 latest draws in Expert Lotto 6/49 Demo Lottery produce the following History sum differences in Level 0:
| 2010/28 Sun 2nd | +13 |
| 2010/28 Sun 1st | -3 |
| 2010/28 Wed 2nd | -13 |
| 2010/28 Wed 1st | +18 |
| 2010/27 Sun 2nd | -1 |
| 2010/27 Sun 1st | -9 |
| 2010/27 Wed 2nd | +6 |
| 2010/27 Wed 1st | +15 |
| 2010/26 Sun 2nd | +13 |
| 2010/26 Sun 1st | +22 |
Positive History Differences analysis shows that the most frequent positive difference is +13 which occurs in two analyzed draws. The same analysis grouped by range of 5 shows that no analyzed draw has positive difference in the range of 0 to 5, there's one draw with the difference in the range of 6 to 10 (2010/27 Wed 2nd), three draws with the difference in the range of 11 to 15 etc. The same analysis grouped by range of 10 shows that the most frequent range of positive history differences is 11 to 20 as there are four such analyzed draws.
Negative History Differences analysis shows that there are four
different negative values (-3, -13, -1 and - 9). When the analysis
results are grouped by range of 5 then the most frequent negative
history difference range is 1 to 5 as there are two such draws (2010/28
Sun 1st and 2010/27 Sun 2nd). Results grouped by range of 10 show that
the range 1 to 10 was found in three analyzed draws.
These statistics track the occurrences of History segment combinations in analyzed draws/tickets.
For example 10 latest draws in Expert Lotto 6/49 Demo Lottery produce the following segment combinations in Level 0:
| 2010/28 Sun 2nd | n/a |
| 2010/28 Sun 1st | 3-3-0 |
| 2010/28 Wed 2nd | 4-0-2 |
| 2010/28 Wed 1st | 3-1-2 |
| 2010/27 Sun 2nd | 4-2-0 |
| 2010/27 Sun 1st | 2-3-1 |
| 2010/27 Wed 2nd | 1-4-1 |
| 2010/27 Wed 1st | 4-1-1 |
| 2010/26 Sun 2nd | 3-3-0 |
| 2010/26 Sun 1st | 3-3-0 |
See Segmentation tab in Summary History window for segment combinations at other Levels.
Segment Combinations analysis of Level 0 for 10 latest draws then shows that the most frequent segment combination is 3-3-0. It hit three times in the analyzed draws and its latest occurrence was just two draws ago. Other segment combinations hit just once and many segment combination haven't been found at all in the analyzed draws, e.g. 6-0-0 or 0-0-6. So the Occurrence column shows value of 0 in corresponding table rows.
These statistics track the count of unique History Sum differences in analyzed tickets. A sum difference is unique if it appears in a single Level only.
For example the History differences for the latest draw in Expert Lotto 6/49 Demo Lottery are: +13, -14, -27, +17, +3, +8, +12, -5, +23, +11, +31 in Levels 0 to 10. None of the values repeat in any other Level so there are 11 unique sum differences for this draw. The analysis of 10 latest draws in that lottery then shows that the most frequent count of unique sum differences is 10 as it was found in five out of ten analyzed draw.
The count of unique sum differences for a single draw is also available in Summary History window under Sums tab in Unique Differences column.
See also Unique Sum Differences filter.
These statistics track how many numbers from analyzed draws/tickets have unique History number difference value in a given Level. A ticket number has unique History difference if it appears alone on a row Segmentation table for given Level.
For example the winning numbers of the latest draw in Expert Lotto
6/49 Demo Lottery look like this in Segmentation table for Level 0 of
previous draw:
Numbers 23 and 29 have the same History difference of 3 so there are only 5 numbers with unique History number difference value in that draw.
Summary analysis of Unique Number Differences of 10 latest draws in that lottery then shows that the most frequent count of numbers with unique differences is 5 numbers as it was found in five of the analyzed draws.
See also Unique Number Differences filter.
These statistics are available in summary form and also as per-ticket properties.
These statistics track the count of pool numbers in History segments generated by analyzed tickets/draws. To count pool numbers in History segments for past winning numbers draws, open Summary History window, switch e.g. to Sums tab and toggle Details button. The lower part of Summary History window will show Number History and Segmentation details for selected draw. Switch to Segmentation details and the table will show numbers from the first segment with white background. Numbers from the second background have pink background and numbers from the last segment have red background.
The example above shows that the latest draw in Expert Lotto 6/49 Demo Lottery has 26 numbers in Segment 1 (there are 26 numbers with white background) and 14 numbers in Segment 2 (numbers with pink background) and 9 numbers from Segment 3. Segment Size analysis of 10 latest draws in that lottery then for example shows that the most common size of Segment 1 in Level 0 is 26 numbers.
The statistics show how many levels have the same segment size as 1, 2, 3 or 4 previous draws.
For example ten latest draws in the demo Expert Lotto 6/49 lottery produce the following segment sizes in Level 2:
| Draw | Segment Size 2 |
|---|---|
| 2010/26 Sun 1st |
27-13-9 |
| 2010/26 Sun 2nd |
25-15-9 |
| 2010/27 Wed 1st |
26-14-9 |
| 2010/27 Wed 2nd |
24-15-10 |
| 2010/27 Sun 1st |
24-15-10 |
| 2010/27 Sun 2nd |
23-15-11 |
| 2010/28 Wed 1st |
23-15-11 |
| 2010/28 Wed 2nd | 24-15-10 |
| 2010/28 Sun 1st | 22-17-10 |
| 2010/28 Sun 2nd | 25-13-11 |
From the table above we can see that the size 23 of segment 1 in draw 2010/28 Wed 1st repeats from the previous draw 2010/27 Sun 2nd.
The size 15 of segment 2 in draw 2010/28 Wed 2nd repeats in four previous draws - from 2010/28 Wed 1st to 2010/27 Wed 2nd. So when analyzing Segment Size Repeats of the latest 10 draw in the demo lottery the table for Segment 2, Repeats 4 will show Occurrence 1 for row labeled "1". It means there is just one level (2) that has the size of segment 2 repeated in four previous draws.
See also Segment Size statistics.
This statistical property shows the History Sum values for tickets in the Package and for past winning numbers.
The property is added for convenience only as it provides the same information which is available in Summary History window under Sums tab.
This statistical property shows the History Differences values for tickets in the Package and for past winning numbers.
The property is added for convenience only as it provides the same information which is available in Summary History window under Sums tab.
This statistical property shows the ratio of odd History sums to even History sums for tickets in the Package and for past winning numbers.
The property is added for convenience only as it provides the same information which is available in Summary History window under Sums tab.
This statistical property shows the minimum and the maximum History Difference for tickets in the Package and for past winning numbers.
The property is added for convenience only as it provides the same information which is available in Summary History window under Sums tab.
This statistical property shows the count of negative and positive History Differences for tickets in the Package and for past winning numbers.
The property is added for convenience only as it provides the same information which is available in Summary History window under Sums tab.
This statistical property shows the standard deviation of History Differences for tickets in the Package and for past winning numbers.
The property is added for convenience only as it provides the same information which is available in Summary History window under Sums tab.
This statistical property shows the History Differences values for tickets in the Package and for past winning numbers.
The property is added for convenience only as it provides the same information which is available in Summary History window under Sums tab.
These statistics track how many numbers from analyzed draws/tickets have unique History number difference value in a given Level. A ticket number has unique History difference if it appears alone on a row Segmentation table for given Level.
For example the winning numbers of the latest draw in Expert Lotto
6/49 Demo Lottery look like this in Segmentation table for Level 0 of
previous draw:
Numbers 23 and 29 have the same History difference of 3 so there are only 5 numbers with unique History number difference value in that draw.
Summary analysis of Unique Number Differences of 10 latest draws in that lottery then shows that the most frequent count of numbers with unique differences is 5 numbers as it was found in five of the analyzed draws.
See also Unique Number Differences filter.
These statistics are available in summary form and also as per-ticket properties.
This statistical property shows the distribution of numbers into History Segments for tickets in the Package and for past winning numbers.
The property is added for convenience only as it provides the same information which is available in Summary History window under Segmentation tab.
This summary statistics shows the frequency of History differences of winning numbers in analyzed draws or tickets.
If we analyze all past draws in Expert Lotto 6/49 Demo lottery we will see that the most frequent History Number Difference in Level 0 is 1. It has been found in 750 analyzed past draws. Its latest occurrence is in the very latest draw (2010/28 Sun 2nd, winning number 42).
On the other hand History Number Difference 46 haven't hit yet.
You can also note that History Number Difference of value 1 is the most frequent one in all History Levels. It is because at least one winning number is very often repeated from the previous draw.
See also History Number Differences filter.
Shows the sum of History differences of the winning numbers of analyzed draw or ticket. The statistics are available for each History level and there is also the total sum across all levels.
The latest winning numbers in Expert Lotto 6/49 Demo lottery are 23-29-36-42-44-47-[7] (draw 2010/28 Sun 2nd). To find their History differences we must click menu History - Summary History, make sure Sums table is showing and then highlight preceding draw, i.e. draw 2010/28 Sun 1st. Then toggle Details button to show Number History details for that draw in the lower part of the Summary History window. We can see that the winning numbers of the latest draw are highlighted with a black border. The number differences of the latest draw in Level 0 are:
| Winning Number | Number Difference in Level 0 |
| 23 | 3 |
| 29 | 3 |
| 36 | 8 |
| 42 | 1 |
| 44 | 11 |
| 47 | 10 |
| Sum: | 36 |
The sum of all Number differences in Level 0 is 36 so the statistical property will be showing value 36 in column Number Differences Sum 0.
These statistics are available in summary form and also as per-ticket properties.
See also Number Differences Sum filter.
This statistics is similar to Number Differences Sum statistics except that it divides all the possible sum values into several ranges.
The values are divided into chunks of ten (1-10, 11-20, 21-30, etc), chunks of 30 (1-30, 31-60, 61-90, etc) and chunks of 50 (1-50, 51-100, 101-150, etc).
See also Number Differences Sum filter and Number Differences Sum statistics.
This statistics show how many History Differences fit into +/-10 range.
For example the latest two draws in Expert Lotto 6/49 Demo lottery have the following History differences:
| Level 0 | Level 1 | Level 2 | Level 3 | Level 4 | Level 5 | Level 6 | Level 7 | Level 8 | Level 9 | Level 10 | ||||||||
| 2010/28 Sun 2nd | 23 | 29 | 36 | 42 | 44 | 47 | [07] | +13 | -14 | -27 | +17 | +3 | +8 | +12 | -5 | +23 | +11 | +31 |
| 2010/28 Sun 1st | 06 | 13 | 14 | 19 | 41 | 42 | [29] | -3 | -28 | -16 | +16 | -35 | -7 | +9 | +7 | +25 | +16 | +21 |
You can see that in the latest draw 2010/28 Sun 2nd there are three Levels where the History difference is in the range of -10 to +10 (highlighted with blue background). In previous draw 2010/28 Sun 1st there are four such Levels (highlighted with green background).
If you analyze the whole winning numbers database of the Expert Lotto 6/49 Demo lottery you will find out that very frequently there are 4 to 5 Levels where the History differences are in the range -10 to +10.
![]() The range values are adjustable in application options under menu Tools - Options - History - Ranges. The default values are -10 to +10.
The range values are adjustable in application options under menu Tools - Options - History - Ranges. The default values are -10 to +10.
These statistics are available in summary form and also as per-ticket properties.
See also Sums History ticket filter - condition The difference in X to Y levels is at most A to B - and Difference Ranges statistics.
Shows whether the History sum value in a given draw and in given Level is greater or lower than the History sum value in previous draw. A plus sign (+) means the History sum is greater than the previous value, a minus sign (-) means the sum is lower. An equals sign (=) means the History sum is the same as in previous draw.
These statistics are available in summary form and also as per-ticket properties.
See also History Sum Movement filter and History Diff Movement statistics.
Shows whether the History difference value in a given draw and in given Level is greater or lower than the History difference value in previous draw. A plus sign (+) means the History difference is greater than the previous value, a minus sign (-) means the difference is lower. An equals sign (=) means the History difference is the same as in previous draw.
These statistics are available in summary form and also as per-ticket properties.
See also History Difference Movement filter and History Sum Movement statistics.
The statistics show the maximum count of consecutive History Levels that have either only negative or only positive History differences.
For example that latest draw 2010/28 Sun 2nd in the demo Expert Lotto 6/49 lottery has the following History difference values:
| Level | Diff |
|---|---|
| 0 | 13 |
| 1 | -14 |
| 2 | -27 |
| 3 | 17 |
| 4 | 3 |
| 5 | 8 |
| 6 | 12 |
| 7 | -5 |
| 8 | 23 |
| 10 | 11 |
| 11 | 31 |
You can see that the longest section of the table above that has only negative differences is between Levels 1 and 2 (orange background). So the Consecutive Neg Diffs for draw 2010/28 Sun 2nd is 2.
The longest section of the table that has only positive differences is between Levels 3 and 6 (blue background). So the Consecutive Pos Diffs for draw 2010/28 Sun 2nd is 4.
These statistics are available in summary form and also as per-ticket properties.
Shows the sum of History differences of the winning numbers of analyzed draw or ticket. The statistics are available for each History level and there is also the total sum across all levels.
The latest winning numbers in Expert Lotto 6/49 Demo lottery are 23-29-36-42-44-47-[7] (draw 2010/28 Sun 2nd). To find their History differences we must click menu History - Summary History, make sure Sums table is showing and then highlight preceding draw, i.e. draw 2010/28 Sun 1st. Then toggle Details button to show Number History details for that draw in the lower part of the Summary History window. We can see that the winning numbers of the latest draw are highlighted with a black border. The number differences of the latest draw in Level 0 are:
| Winning Number | Number Difference in Level 0 |
| 23 | 3 |
| 29 | 3 |
| 36 | 8 |
| 42 | 1 |
| 44 | 11 |
| 47 | 10 |
| Sum: | 36 |
The sum of all Number differences in Level 0 is 36 so the statistical property will be showing value 36 in column Number Differences Sum 0.
These statistics are available in summary form and also as per-ticket properties.
See also Number Differences Sum filter.
The statistics show how many History differences repeat in the same Level from previous draws. The statistics are given for repeats from a single previous draw and for repeats from 5, 10, 15, 30 and 50 previous draws.
For example draw 2010/27 Sun 1st in the demo Expert Lotto 6/49 lottery has two History differences repeated from the previous five draws. The History difference 14 in Level 3 repeats from draw 2010/26 Sun 2nd and History difference 6 in Level 6 repeats from the previous draw 2010/27 Wed 2nd.
These statistics are available in summary form and also as per-ticket properties.
The statistics show whether a History difference in a given Level is in pre-defined of -10 to +10, above that range or below that range. The value range is adjustable in application options under menu Tools - Options - History - Ranges. The default values are -10 to +10.
Value "in range" means that the History difference value is in pre-defined range. Value ">" means the difference is above the pre-defined range, value "<" means the differences is below the pre-defined range.
These statistics are available in summary form and also as per-ticket properties.
See also In Range Differences statistics.
Menu command Tools - Playslips opens Playslips window listing all playslip layouts that are available for current lottery. Playslip layout is a template defining how to print ticket numbers to paper playslips.
There are two types of playslip layout:
The playslips are listed in a table with two columns. The first column shows playslip layout name - usually the same as the name of the lottery the playslip is designed for. The second column shows the country the lottery is being played in. Click any column header to sort the list alphabetically. The details of the selected playslip are shown in the fields beneath the table.
Use the buttons next to the table to manage the playslip database:
Note: Deleting any .playslip file using e.g. file manager application also removes the playslip layout reference from the database on next application startup.
Playslip Layout Wizard opens from Playslips window. It can be used to design a new playslip layout or to customize an existing one. The playslip design consists of several steps:
Enter playslip name and the name of the country the lottery is being played in. The playslip name should usually match the name of the lottery it is being designed for.
Also select the measurement units you will be using when entering playslip dimensions.
Playslip width and playslip height refer to the width and height of the whole paper playslip respectively.
Single number box dimension define the width and height of a small square that is used to mark a single ticket number on the playslip. You can choose the shape and color of the mark in appropriate combo boxes.
Important: Turn the paper playslip to align the numbers in playslip's grids in the same way as displayed in Ticket Panel window before taking any measurements! The position of the lowest number, the ordering of numbers (left-to-right, top-to-bottom) and the number of columns and rows must match exactly the Ticket Panel window otherwise the ticket numbers will be printed at wrong positions.
Pool numbers are usually arranged into a grid with several columns and rows. Enter the width and height of the grid into edit fields. When designing playslip layout for a Powerball lottery you must also enter the dimensions of grids for powerball numbers.
Note: The current lottery defines the number of columns, the number of rows and the ordering of numbers in each grid. If these settings do not match the paper playslip you need to first create a new lottery before designing its playslip layout.
Select how many tickets you can print to a single paper playslip. Then enter the location of each number grid. When designing playslip layout for a Powerball lottery you must also enter the location of grids for powerball numbers.
Extra boxes on a playslip are usually used to select the amount of money to bet or how many times the bet should repeat. First enter the count of such boxes on your playslip then enter the location of each box. Also provide descriptive names for extra boxes - they will show in Print to playslips window.
When printing to playslips it is possible to print also the indexes of tickets printed on the playslip. It might be useful when printing to a large number of playslips and one or more playslips failed to print correctly, e.g. because the paper loader didn't load the playslip straight. Then you can print again just the playslips that failed instead of re-printing the whole batch of playslips.
Enter the location where the ticket numbers should be printed at. You should pick a location that doesn't affect number grids otherwise the printed playslip may be rejected by scanning machine in lottery agent shop.
Finally review the complete playslip layout and make sure it matches the actual paper playslip. Click button Print to make a test print out to a plain letter size paper and try matching the printed sheet with the paper playslip. If the test printout differs from the paper playslip use button Previous in the wizard window to repeat the wizard's step and fix the errors.
![]() Hover mouse cursor above edit fields in wizard window to see an image
tooltip providing a visual hint which measurements are to be taken.
Hover mouse cursor above edit fields in wizard window to see an image
tooltip providing a visual hint which measurements are to be taken.
Number groups divide all or selected pool numbers into several sub-pools or groups. Usually the whole number pool is divided into evenly sized groups and tickets are analyzed to see how many groups their numbers fall in. Ticket filter accepting tickets that have (not) numbers in selected groups is also available.
There are two types of number groups:
You can define several named sets of number groups using Number Groups Manager. The number groups are then available in Number Groups filter and statistics.
Number Groups Manager window opens from menu Tools - Number Groups. In this window you can see a list of all number groups defined for the current lottery. Use the buttons at the top of the window:
It is possible to create number groups consisting of hot, cold and warm numbers. First select past draws to calculate hot/cold numbers from. Then choose how many of those draws should be used to find hot numbers. Next you need to specify the minimum occurrence of hot numbers and the minimum occurrence of warm numbers. The actual distribution of pool numbers into hot/cold and warm categories is given in the table at the bottom of the window.
For example ten latest draws in Expert Lotto 6/49 demo lottery are:
| 2010/28 Sun 2nd | 23 | 29 | 36 | 42 | 44 | 47 | [07] |
| 2010/28 Sun 1st | 06 | 13 | 14 | 19 | 41 | 42 | [29] |
| 2010/28 Wed 2nd | 02 | 13 | 16 | 17 | 25 | 40 | [27] |
| 2010/28 Wed 1st | 16 | 18 | 22 | 23 | 28 | 29 | [24] |
| 2010/27 Sun 2nd | 01 | 06 | 12 | 24 | 32 | 41 | [44] |
| 2010/27 Sun 1st | 02 | 15 | 22 | 29 | 30 | 37 | [42] |
| 2010/27 Wed 2nd | 20 | 23 | 25 | 30 | 33 | 35 | [07] |
| 2010/27 Wed 1st | 08 | 11 | 19 | 26 | 48 | 49 | [18] |
| 2010/26 Sun 2nd | 08 | 11 | 18 | 32 | 36 | 38 | [06] |
| 2010/26 Sun 1st | 05 | 06 | 11 | 31 | 40 | 43 | [32] |
Let's use the following settings to create Hot/Cold/Warm groups:
It means the hot/cold numbers will be calculated from the occurrences of pool numbers in the latest 10 draws (see the table above). The draw limit field divides the table into two parts. The latest 4 draws have orange background, the previous six draws have blue background.
A number is hot if it hit at least two times in the orange section (before draw limit) and at least once in the blue section (after draw limit). In this example there are only two such numbers - 23 and 29.
If we change the settings to Min occurrence of hot numbers before draw limit: 2 After draw limit: 0 then there will be five hot numbers - 13, 16, 23, 29, 42. They are numbers that hit at least twice in the orange section.
A number is warm if it isn't hot and if it hit at least two times in the selected ten past draws. There are 16 such numbers, for example 2, 6, 8, 11 etc.
All other numbers are cold - they hit at most once in the latest ten draws. There are 31 cold numbers in this example - 1, 3, 4, 5, 7, 9 etc.
Note: Number groups created this way are static - so when you add fresh winning numbers into your database you have to create new Hot/Cold numbers groups to take the latest numbers into account.
Clicking ![]() Import button in Manager's window toolbar opens standard Open file window where you can browse a text file that will be converted into a new set of discrete number groups. The file being imported is expected in the following format:
Import button in Manager's window toolbar opens standard Open file window where you can browse a text file that will be converted into a new set of discrete number groups. The file being imported is expected in the following format:
After successful file import it is possible to remove or edit the original imported file - the numbers groups created by the import action will remain unchaged.
The wizard window opens from the Number Groups Manager either to create a new number group or to customize an existing one.
First select how many groups you want to divide the pool numbers into. Then choose whether you want to have continuous range of numbers in each group or whether you want to have hand-picked numbers in each group.
Enter the name for the set of number groups. This name will show in
Number Groups Manager window and in Number Groups filter window. By
default all new Number Groups are available in Number Groups filter. If
you also want to see statistics of distribution of ticket numbers into
the number groups, select options Show in Analyzers and/or Show in
Statistical properties. Option Show in Number matrix windows adds a new
layout to Package Matrix and Winning Numbers Matrix windows where you
can see visual representation of selected number groups.
The goal of all lottery strategies is the prediction of winning numbers that will hit in the next draw. Lottery players in most cases search for the most frequent or the least frequent numbers, then examine the latest winning numbers and/or their statistical properties trying to guess what is the most likely to happen in the next draw.
Expert Lotto has built-in tool which automates the prediction process to some extent. The application will search through selected past draws and compare them with the latest winning numbers to predict the numbers and statistical properties that are expected in the coming draw. As all other Expert Lotto features, the predictions are based on solid math. With the same input data and the same settings the predictor will always provide the same, reproducible results. There is no magical black-box spitting out different numbers each time it is clicked. Expert Lotto predictor is based on pattern matching algorithm which is widely used in many other computer-assisted fields – facial recognition, statistical data analysis, signal processing etc.
The following table lists 15 latest draws in Expert Lotto 6/49 lottery in descending order:
| Date | Position 1 | Position 2 | Position 3 | Position 4 | Position 5 | Position 6 | Bonus |
| 2010/28 Sun 2nd | 23 | 29 | 36 | 42 | 44 | 47 | 7 |
| 2010/28 Sun 1st | 6 | 13 | 14 | 19 | 41 | 42 | 29 |
| 2010/28 Wed 2nd | 2 | 13 | 16 | 17 | 25 | 40 | 27 |
| 2010/28 Wed 1st | 16 | 18 | 22 | 23 | 28 | 29 | 24 |
| 2010/27 Sun 2nd | 1 | 6 | 12 | 24 | 32 | 41 | 44 |
| 2010/27 Sun 1st | 2 | 15 | 22 | 29 | 30 | 37 | 42 |
| 2010/27 Wed 2nd | 20 | 23 | 25 | 30 | 33 | 35 | 7 |
| 2010/27 Wed 1st | 8 | 11 | 19 | 26 | 48 | 49 | 18 |
| 2010/26 Sun 2nd | 8 | 11 | 18 | 32 | 36 | 38 | 6 |
| 2010/26 Sun 1st | 5 | 6 | 11 | 31 | 40 | 43 | 32 |
| 2010/26 Wed 2nd | 4 | 18 | 26 | 33 | 35 | 47 | 11 |
| 2010/26 Wed 1st | 5 | 12 | 25 | 31 | 44 | 46 | 33 |
| 2010/25 Sun 2nd | 10 | 15 | 28 | 30 | 36 | 43 | 35 |
| 2010/25 Sun 1st | 16 | 21 | 24 | 25 | 35 | 46 | 47 |
| 2010/25 Wed 2nd | 9 | 12 | 23 | 34 | 39 | 49 | 24 |
The latest three numbers at the second ticket position are: 13, 13 and 29. Those three numbers form the latest pattern. The pattern size is 3 as it consists of three numbers.
Now we will search the past winning numbers at the second ticket position and look for a similar pattern. The table above shows that the best matching past pattern can be found in draws 2010/26 Sun 2nd to 2010/27 Wed 2nd. The past winning numbers are 11, 11 and 23. The following draw is 2010/27 Sun 1st where the second winning number is 15. So the prediction for the coming draw 2010/29 Wed 1st is number 15 at the second ticket position.
Let's verify our prediction in Expert Lotto:
Winning Number Properties window opens and its table will show the following value in Position 2 column:
The downward red triangle indicates that the predicted trend is decrease in the next draw and the number predicted for the second ticket position is 15. See below for more instructions how to interpret the prediction results.
If we let the predictor scan the whole database of past winning numbers then it will find the best matching pattern in draws 2006/23 Sun 2nd to 2006/24 Wed 2nd. Their winning numbers are 12, 16 and 30. The following winning number at the second ticket position is 11. That means the predicted trend is again decrease and the predicted value is 11.
What happens if we increase the pattern size from three numbers to 10 numbers? The latest pattern is then 6,11,11,23,15,6,18,13,13,29. When displayed in a chart the numbers look like this:
The predictor will find best matching pattern in draws 2008/45 Sun 2nd to 2008/48 Wed 1st where the winning numbers are 9,20,13,21,12,8,15,15,4,27. The numbers in a chart look like this:
The following number at the second ticket position is again 11 (draw 2008/48 Wed 2nd). That means the predicted trend is again decrease and the predicted value is 11.
If you compare the chart of the latest pattern and the chart of the found matching pattern above, you can see that the match is actually very loose. But it is still the best match the predictor can find in the whole database of past winning numbers. We cannot realistically expect to find a sequence of past winning numbers that is exactly the same as the ten latest draws. The longer the patterns are the less similarities between the latest pattern and the best matching pattern. So how to select the optimal pattern size?
In the examples above we used pattern size 3 which gave us predicted value 11 and pattern size 10 also with predicted value 11. In this case we have the same results. But what if the predicted values or even the predicted trends were different? How to tell which prediction is more credible?
The predictor runs a series of tests and selects the best pattern size automatically. Option Latest draws for back-testing in prediction settings screen defines how deep this back-testing is. If the prediction settings are for example Pattern size min 3, max 15, Latest draws for back-testing: 10 then the predictor will make 130 predictions to pick the optimal pattern size. It will start with pattern size 3, make prediction for draw 2010/28 Sun 1st and compare the predicted trend with actual value from the following draw 2010/28 Sun 2nd. Then it will make prediction for draw 2010/28 Wed 2nd and compare the predicted trend with the value from the following draw 2010/28 Sun 1st. There will be 10 such testing predictions up to draw 2010/26 Wed 2nd. The predictor will count how many predicted trends were correct when compared with the following draws.
Then the pattern size will increase to four and the predictor will make another ten testing predictions for ten latest draws. The count of correct trend predictions is noted. The pattern size is increased to five and the testing runs are repeated. This continues up to pattern size 15 as selected in prediction settings. Then the predictor will select the pattern size that had the highest count of correct trend predictions. This optimal pattern size is then used to make the actual prediction for the latest draw 2010/28 Sun 2nd. In this case the best pattern size is 3 because seven trend predictions were correct during back-testing. When using pattern size 10, there were only 4 valid trend predictions out of the ten back-test runs.
![]() Hover mouse cursor above table cell with prediction result to see a tooltip with the best pattern size and the count of back-test predictions that were correct.
Hover mouse cursor above table cell with prediction result to see a tooltip with the best pattern size and the count of back-test predictions that were correct.
With option Back-testing compares values you can modify the prediction algorithm to select the pattern size that predicts values which are closest to the actual values when back-testing.
![]() Some lottery operators publish additional details about each draw – which set of balls has been used, which drawing machine etc. If the balls and/or machines are being changed at regular intervals it probably makes sense to use pattern sizes shorter than the interval between such changes.
Some lottery operators publish additional details about each draw – which set of balls has been used, which drawing machine etc. If the balls and/or machines are being changed at regular intervals it probably makes sense to use pattern sizes shorter than the interval between such changes.
The predictor has two modes of pattern matching. It can match either absolute values in a sequence of numbers as demonstrated above or it can match number differences instead. Let's have the following sequence of numbers:
31,35,13,20,15,5,2,10,4,25,3,10,5
Let's consider the last three numbers as the latest pattern: 3,10,5. When matching absolute values then the best matching pattern is 2,10,4 followed by number 45. However when matching number differences then the best matching pattern is 13,20,15 followed by number 5.
The same sequence of numbers expressed as value differences looks like this:
+31,+4,-22,+7,-5,-10,-3,+8,-6,+21,-22,+7,-5
So the latest pattern has changed to -22,+7,-5 and the best matching pattern is -22,+7,-5 corresponding to numbers 13,20,15 followed by number 5. So when matching differences the matching pattern must have the same shape (the order of increasing/decreasing values) as the latest pattern however all its values may be shifted up or down when compared with the latest pattern.
Now we will repeat the prediction for the second ticket number and use differences pattern matching instead of absolute values:
The best matching pattern are draws 2006/20 Wed 1st to 2006/20 Sun 1st with numbers 4,4,21, which translate to differences -3,0,+17. The following difference is -8.
The differences of the latest pattern are -5,0,+16. The predicted value is
29 – abs( -8 * (abs(-5/-3) + abs(0/0) + abs(16/17)) / 3 * ) = 29 – 9.62 = 19.
Note that the predicted value includes correction which takes into account the differences between the latest and best matching patterns.
The same prediction with pattern size 10 will find the best matching pattern at draws 2009/24 Wed 1st to 2009/26 Wed 2nd where the numbers are 5,15,15,20,13,10,14,9,6,11 and the following number is 21. The prediction is increase to 46. This prediction is conflicting with the prediction with pattern size 3. However this prediction is a bit less credible as the back-testing passed in 5 out of 10 back test runs, while pattern size 3 predictions had 6 valid trend predictions during back-testing.
![]() It is recommended to use differences pattern matching especially for predictions of derived values like History sums and differences. Absolute values pattern matching is suitable for values with a small range, for example sum root, odd/even or the actual winning numbers at individual ticket positions.
It is recommended to use differences pattern matching especially for predictions of derived values like History sums and differences. Absolute values pattern matching is suitable for values with a small range, for example sum root, odd/even or the actual winning numbers at individual ticket positions.
Pattern matching slider in Predictions Options window adjusts the weights of individual numbers when the patterns are being compared. When the slider is moved fully to the right then the pattern matching is strict and each number has the same weight.
Moving slider to the left relaxes the pattern matching as the numbers of the patterns being matched have lower weight when comparing them together. If the latest pattern is for example 6,11,11,23,15,6,18,13,13,29 then strict pattern matching may find for example pattern 9,20,13,21,12,8,15,15,4,27. With relaxed matching the best found pattern will be for example 33,16,25,14,31,11,18,12,16,30. As you can see the first few numbers of the best matching pattern match the latest pattern very loosely only. In both cases the predicted value is 10 however with relaxed pattern matching there were 9 valid back-test predictions while the strict matching produced only 7 valid predictions when back-testing on 15 latest draws. Relaxed pattern matching is recommend only when using larger pattern sizes (10 and more).
Predictions are available either from menu Winning Numbers – Predictions or from menu History – Predictions. Both menu commands start Predictions wizard.
You can track the progress of the prediction process at the lower right corner of the main window. When the process is finished the prediction results are available in Winning Numbers Properties and Winning Numbers Charts windows or in Summary History window under Sums and Charts tabs.
![]() – blue triangle indicates that the predicted trend is increase. That means the next value is expected to be greater than the latest value. The actual predicted value is also available.
– blue triangle indicates that the predicted trend is increase. That means the next value is expected to be greater than the latest value. The actual predicted value is also available.
![]() – red triangle indicates that the predicted trend is decrease. That means the next value is expected to be lower than the latest value.
– red triangle indicates that the predicted trend is decrease. That means the next value is expected to be lower than the latest value.
![]() – when both red and blue triangles are present in table cell then the predicted trend is level. That means the next value is expected to be the same as the latest value.
– when both red and blue triangles are present in table cell then the predicted trend is level. That means the next value is expected to be the same as the latest value.
Note: The predictions algorithm operates just with a sequence of numbers. In some cases the predicted value can be lower or higher than the minimum or maximum possible values. In such cases you should consider the predicted trend only.
Value n/a in prediction results means it was not possible to make valid prediction. Usually because there are not enough data to select the matching pattern.
![]() The predicted trend should be the main indicator when estimating values for the coming draw. The actual predicted value should be only a hint showing how big the predicted increase or decrease is.
The predicted trend should be the main indicator when estimating values for the coming draw. The actual predicted value should be only a hint showing how big the predicted increase or decrease is.
Hover mouse cursor over predicted cell to see a tooltip with additional information regarding the prediction. You can see how many back-test predictions were correct and the pattern size that has been used for predictions.
![]() It is recommended to ignore predictions with low percentage of successful back-test by entering required percentage of successful back-test into the last input field.
It is recommended to ignore predictions with low percentage of successful back-test by entering required percentage of successful back-test into the last input field.
Detailed information about the prediction process is available in Application Log. When the predictions are finished click menu View – Application Log. The Output window then shows the following details for each predicted value. For example:
Position 2 – name of the predicted value. In this case it is the winning number at the second ticket position.
Trend prediction: Decrease – predicted trend (increase/decrease/level)
Predicted value: 10.0 – the actual predicted value. Please note that all values are zero-based so the predicted winning number is 11.
Best pattern size: 5 – the pattern size used for the prediction.
Best weight: 1.0 – the weight used for pattern matching. The weight is always 1.0 unless relaxed pattern matching has been used.
Matching pattern: [10.0 17.0 11.0 15.0 29.0] => 10.0 – the best matching pattern found. In the case the best pattern are numbers 11,18,12,16,30. The number following this pattern is 11.
Marker: 94 – the position in the sequence of numbers where the best matching pattern has been found. Value 0 means the oldest draw.
Back-tests: 15 – the count of back tests that have been carried out to validate the pattern size.
Mean Square Error: 107.66666666666667 – shows how much the back-test prediction values differ from the actual values. The lower MSE the more accurate the back-test prediction values are.
Mean Absolute Percentage Error: 0.6399601052542229 - MAPE indicator also compares the back-test predictions with the actual values.
Valid trend predictions: 6 (40.0%) - how any back tests produced correct trend prediction.
See also Trend Predictions filter.
Number Coloring is a tool to enhance visual perception of ticket numbers displayed in various tables.

The winning numbers table will look like this:
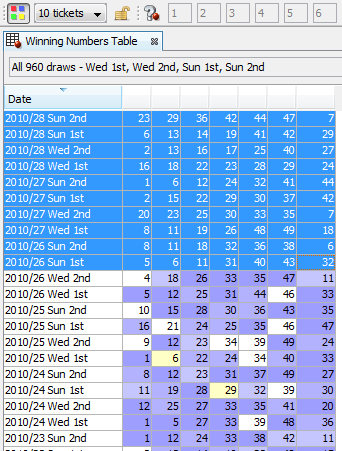
You may note that for example number 4 in draw 2010/26 Wed 2nd has white background. That is because number 4 hasn't been found in the selected 10 latest draws. On the other hand number 18 in the same draw has blueish background to indicate that it appears two times in the selected draws. Number 6 in draw 2010/25 Wed 1st has yellow background which means it was drawn three times within the latest 10 draws.
This way you can quickly evaluate the frequency of each pool
number in the selected set of draws or tickets because number coloring
generated from winning numbers table is automatically transferred to
other application windows displaying draws, tickets or just separate
ticket numbers. If you find number coloring too distracting you can
turn it off by clicking On/Off button in the toolbar:
You can also hide number coloring
toolbar using menu View - Toolbars - Number Coloring to turn it off.
Click menu Tools - Options - Number Coloring - Ticket Tables to customize the default colors. The options window also contains switch Include bonus numbers. When this switch is turned off then the number frequency coloring will be calculated from the main numbers of selected tickets only.
The current number coloring depends on current active window. For example:
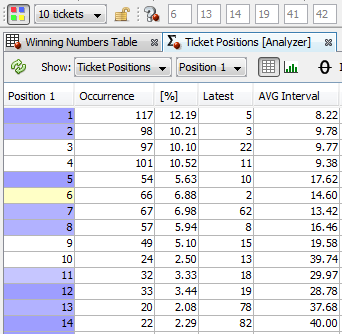
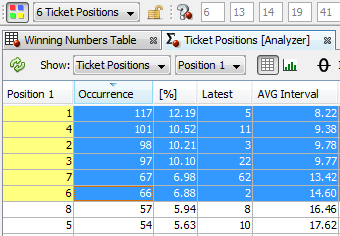
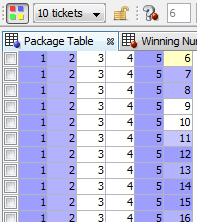
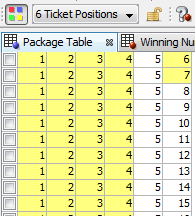


Besides the number coloring based on the occurrences of selected numbers you can also choose one of the built-in number coloring schemes using combo box in number coloring toolbar:
"What if these numbers came up in the next draw?" That is the question asked very frequently when a lottery strategy is being tested or when numbers are being selected for the next draw.
Use menu View - Toolbars - What If to toggle What-If toolbar on, then click on/off button on the toolbar: 
Now
you can enter numbers into edit fields in the toolbar and observe other
application windows to see how various statistics and charts would
change if the entered numbers came up in the next draw. It is basically
the same as if a temporary draw with the given numbers was added to
winning numbers database.
More convenient usage of What-If feature is selecting a ticket in any window showing a table of tickets or draws. For example you can open Package Table window and select any ticket in the table to use its numbers as What-If. Then you can analyze changes in e.g. winning numbers charts or History tables.
Note:
What-If numbers are automatically synchronized with the last active
window containing a table of tickets. When switching between such
windows the what-if numbers will change accordingly. You can click Lock button in What-If toolbar to make the current what-if numbers
permanent:
Then
the what-if numbers remain the same regardless which window is
activated. To turn automatic synchronization of what-if numbers on
again, click Unlock button in What-If toolbar:
![]() When entering numbers from keyboard prepend single-digit numbers with zero to
automatically move input focus into the next number field. For example
enter "01" instead of "1".
When entering numbers from keyboard prepend single-digit numbers with zero to
automatically move input focus into the next number field. For example
enter "01" instead of "1".
When cut-off draw date is set then the winning numbers for the given draw and all following draws are 'hidden' from the winning numbers database and will not show in any application window. This is very useful for back-testing of your lottery strategies. You can hide one or more latest draws and then investigate, which combination of filters yields the expected winning numbers.
The cut-off draw date is adjustable in the main toolbar area. First toggle the cut-off date on by clicking this button ,
then choose the desired date in the combo box next to it. All draws
with selected date and all following draws won't show in any
application window except for the Winning Numbers Manager. If the
toolbar isn't showing click menu View
- Toolbars - Cut-off Draw Date to turn it on. Another way to temporarily hide some draws is offered in Winning Numbers Manager window.
,
then choose the desired date in the combo box next to it. All draws
with selected date and all following draws won't show in any
application window except for the Winning Numbers Manager. If the
toolbar isn't showing click menu View
- Toolbars - Cut-off Draw Date to turn it on. Another way to temporarily hide some draws is offered in Winning Numbers Manager window.
![]() When the cut-off draw date is on then you can hover your mouse
above the combo box in the toolbar to see the winning numbers of the
selected draw.
When the cut-off draw date is on then you can hover your mouse
above the combo box in the toolbar to see the winning numbers of the
selected draw.
To see again all the draws from the winning numbers database
click button again or turn the cut-off date
toolbar off using menu View - Toolbars.
![]() When cut-off draw is active then draw selection fields
start with a star sign (*) to indicate that some draws are hidden.
When cut-off draw is active then draw selection fields
start with a star sign (*) to indicate that some draws are hidden.
See also Number Coloring Numbers after Cut-off
If a lottery draws winning numbers only in certain days of the week or if there are multiple sets of winning numbers on each day then this tool allows to select which days or draws are included in the selection of past winning numbers. These settings are applied before any selection of past draws throughout the whole application.
This way it's easily possible to filter or analyze particular draws or days of week without adjusting your saved complex filters or custom analyzers.
 ,
a dialog window will pop up where you can tick the draw(s) or day(s) you are interested in. Draws
and days that are not ticked in this window won't show in any
application window except for the Winning Numbers Manager. If the
toolbar isn't showing click menu View
- Toolbars - Draw Date Pre-Filter to turn it on.
,
a dialog window will pop up where you can tick the draw(s) or day(s) you are interested in. Draws
and days that are not ticked in this window won't show in any
application window except for the Winning Numbers Manager. If the
toolbar isn't showing click menu View
- Toolbars - Draw Date Pre-Filter to turn it on.
To work again with all the draws from the winning numbers database
click button again or turn the toolbar off using menu View - Toolbars.
![]() When draw date pre-filter is active then draw selection fields
start with a star sign (*) to indicate that some draws are hidden.
When draw date pre-filter is active then draw selection fields
start with a star sign (*) to indicate that some draws are hidden.
See also Draw Date Cut-off
Ticket Panel window is accessible from menu Tools - Ticket Panel. It shows pool numbers aligned to a grid with the same shape as on the actual paper playslip.
When a single ticket is selected in a Package window (Table, Matrix, Properties or Winnings) then its numbers are displayed in this window as crosses on appropriate number boxes.
Likewise, when a single draw is selected in a winning numbers window (Table, Matrix, Properties or Charts) then its main numbers and bonus or power numbers are displayed in this window as crosses on appropriate number boxes.
When a Package Matrix or Winning Numbers Matrix window is active then you can click any number box to toggle the highlight of that number in the matrix window.
Note: When playing a lottery which draws all main numbers from a single pool it is possible to define custom layout for the Ticket Panel window by clicking Edit button in the lower right corner
Note: Boxes with dark background represent masked ticket positions.
Note: Bonus or powerball numbers use a different marker shape.
![]() You can click
You can click ![]() button to right of the ticket panel to clear all the numbers in the ticket panel. Use
button to right of the ticket panel to clear all the numbers in the ticket panel. Use ![]() button to tick all highlighted numbers.
button to tick all highlighted numbers.
This action is available from menu Edit - Find.
You can use it to find a ticket with given numbers in a ticket table:
Note: You can use the same steps to find a past draw with given numbers in any of Winning Numbers windows (table, matrix or properties).
You can export any table in any application window using menu command File - Export. This opens Export Table window where you can choose the output format:
You can also choose whether you want to export all table rows or only the rows that are selected in the exported table. The last option allows opening the exported file in the application that is assigned as the default one for the selected file format in your operating system.
Click button Export to open standard file browser window and select the folder and file name to export the table to.
Note: In some cases you have to first click into the table you wish to export to have the menu command enabled.
You can print any table in any application window using menu command File - Print. This opens Print Table window where you can specify print options.
Click button Print to print the table on the default printer, click button Options to select a different printer and/or adjust printer settings.
Note: In some cases you have to first click into the table you wish to print to have the menu command enabled.
If you were using Expert Lotto version 4.x to play a lottery that isn't listed on Expert Lotto web site, for example a custom created lottery, you must first import that lottery into Expert Lotto 5. The lottery format has changed in Expert Lotto 5 and you cannot directly open a lottery from version 4.x in Expert Lotto 5 without converting it to a new format.
This options panel allow adjustments of winning payouts. The table lists all winning prizes as define in lottery settings and in the second columns are the default payouts for the given prize. Double-click any cell to enter a new value.
Field Single ticket cost show how much you must pay to play a single ticket.
You can also adjust the currency format. The default value comes from the settings of your operating system.
Values in this options panel are used to calculate the total winnings, net profit and the cost of the whole bet in Package Winnings and in Summary Winnings windows respectively.
Also Performance tab in Complex Filter window shows the possible net profit
if the tickets accepted by the filter were bet in past draws.
Note: This options panel opens from menu Tools - Options - Miscellaneous - Payouts.
In this options panel you can adjust colors that are assigned to individual number frequencies. Click the colored circle for appropriate number frequency to open color picker window and choose a different color.
If you don't want to use Number Coloring for a particular frequency then untick the appropriate check box. Then the numbers with the given frequency will have the default background color - usually white.
Note: This options panel is available from menu Tools - Options - Number Coloring.
In this options panel you can adjust the settings for Number Coloring based on hot/cold numbers. The settings also apply to Hot/Cold Numbers statistics.
Note: This options panel opens from menu Tools - Options - Number Coloring - Hot/Cold.
INFO [ACTIVITY]Note: This options panel opens from menu Tools - Options - Miscellaneous - Execution.
Note: This options panel opens from menu Tools - Options - Miscellaneous - Imports & Exports
This options panel allows customization of chart windows.
Note: This options panel opens from menu Tools - Options - Charts.
When requesting a new source for winning numbers online update you must provide the following information:
The link must point to a downloadable file with complete history of winning numbers in a plain text or CSV format. It isn't possible to provide online update of winning numbers from a web page which does show a table of past winning numbers but also some menus, advertisements, various links etc. Even a slightest change in HTML formatting can break the parsing process or even introduce errors into winning numbers database.
After
clicking OK button the application will check that the download links
is valid (internet connection is required) and then open an email
window addressed to the Expert Lotto development team. After receiving
this email Expert Lotto developers will implement the new online source
and provide it as an application update.
Note: The actual implementation time depends on available development resources.
When you download and install Expert Lotto then the application runs in unregistered free mode where some of the advanced features are disabled. The unregistered version of Expert Lotto provides enough features to satisfy most lottery players. You can track past winning numbers, check your winnings, create, load and save wheels, analyze statistics and many more. However if you are really into lottery cracking business you should consider registering your copy of Expert Lotto to get access to its advanced and unique features (read more here). To unlock the disabled features and use application's full potential, you must enter license key.
If you have already received your Expert Lotto license key by email then follow these instructions to register your copy of Expert Lotto.
button at the
top-right corner of License Key Activation window.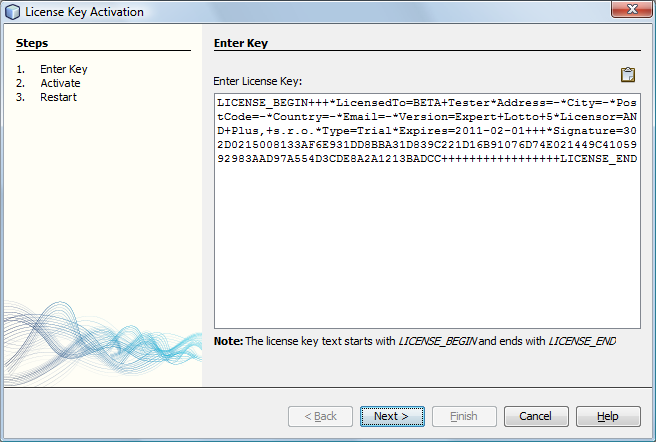
When the application is successfully registered the About window (menu Help - About) shows your name, street address, email and other registration details you've entered when obtaining the license key.
Note: It is not recommended to enter the license key by typing
it
directly from keyboard as it is very error prone because the license
key text is very long.
Options Moving average specify the count of data points to calculate moving average values in winning numbers charts and in interval sequence charts respectively.
In this options panel you can customize Package Properties and Winning Numbers Properties windows. Use check boxes in Package properties and in Winning numbers properties lists to show or hide statistical properties. Each item in the list corresponds to one column (or several column in case of positional statistical properties) in Package Properties or Winning Numbers Properties windows respectively.
![]() It is possible to change the columns visible in statistical tables by clicking Columns button in their upper left corners. That opens Select Columns window where you can tick the statistical properties you wish to see.
It is possible to change the columns visible in statistical tables by clicking Columns button in their upper left corners. That opens Select Columns window where you can tick the statistical properties you wish to see.
Draws settings at the bottom of the options window selects past draws for statistical properties which are based on winning numbers. For example selecting 10 latest draws means that statistical properties like Repeating Numbers will search for repeating numbers in the 10 latest draws.
Option Decimal places defines the count of decimal places to be used in statistical tables.
Option Show table row numbers in a tooltip applies to statistical tables in Analyzer window. When this option is on then hovering mouse cursor over any analyzer table row shows the row number in a tooltip. This can be useful especially when evaluating statistical tables with a large number of rows.
This panel lists Combined Statistics that are available for the current lottery. Click button Add to setup new combined statistics. The button opens a new window where you can combine up to five different statistical properties together. Use combo boxes to select the desired statistics and enter some descriptive name for the new statistics into Title field. The name will then shown in statistical tables and charts. Click button Ok and analyze past winning numbers draws or tickets in the Package to see the values of the new combined statistics.
To customize existing combined statistics, first select them in the list, then click button Modify.
To create a copy of existing combined statistics, first select them in the list, then click button Duplicate.
Button Remove permanently deletes the selected combined statistics. If you (accidentally) remove all combined statistics, the application will automatically recreate the default ones which are included in default Expert Lotto distribution.
Buttons Move Up and Move Down change the position of select combined statistics. The order of statistics in the list matches the order of statistics in Ticket Properties window and in Package Properties and Winning Numbers Properties windows.
Option Show background colors in statistical properties tables toggles cell background colors for Winning Numbers Properties and Package Properties tables respectively to allow easier perception of displayed values. When turned on each table column will have different background color. If the table has more than 10 column then the colors sequence will repeat. The colors are adjustable by clicking the colored buttons.
This panel allows to select up to three draw distances for Vertical Pairs Sum statistical properties in Winning Numbers Properties and Package Properties windows.
Note: This options panel opens from menu Tools - Options - Statistics.
Replace Ticket window opens from menu Edit - Replace. You can use it to change the numbers of a selected ticket in the Package. The numbers being replaces are shown in read-only boxes at the top of this window. Enter new ticket numbers into edit fields or click appropriate boxes in the Ticket Panel to select new ticket numbers.
Button Replace changes the ticket numbers in currently selected ticket only. Button Replace All scans the whole Package and replaces the numbers of all tickets with the same numbers as the selected ticket. When finished the status bar at the bottom of the main application window shows the count of replaced tickets.
Note: The menu command is enabled only when a Package window is activated (Table, Matrix, Winnings, Properties) and just one ticket is selected in Package table.
Filter reference is a link to complex filter stored on your disk. With filter references you can link multiple complex filters with each other.
Click Browse button to select a different complex filter filter.
Click Edit button to open the referenced complex filter in a new window.
Tickets Analyzer wizard opens from menu File - New - Analyzer. You can use it create a new Analyzer window.
The wizard consists of three steps:
Select tickets to be analyzed by clicking Select button.
![]() Use menu Package - Analyze to analyze tickets in the Package or use
menu Winning Numbers - Analyze to analyze past draws and skip the first
step in Ticket Analyzer wizard.
Use menu Package - Analyze to analyze tickets in the Package or use
menu Winning Numbers - Analyze to analyze past draws and skip the first
step in Ticket Analyzer wizard.
Select past draw to use for draw interval analysis. If you don't need draw interval information, untick Analyze intervals of past winning numbers option. The ticket analysis will be much faster and less memory expensive.
Select statistics you wish to analyze.
Click Finish button to open Analyzer window and calculate the selected statistics.
With combined statistics it is possible to group up to five different statistics into a new, single statistical property and thus track the combination of statistical properties as a single event. Expert Lotto ships with three predefined combined statistics:
Use menu Tools - Options - Statistics to define new combined statistics or to customize the existing ones.
When History Level Synchronization is turned on in the main menu (History - Synchronize Levels) then all History-related windows will automatically switch to have the same Level selected.
This options panel opens from menu Tools - Options - Keymap and you can use it to customize keyboard shortcuts.
This window opens after clicking Columns button in the upper left corner of Winning Numbers Properties window or Package Properties window.
The window shows a list of all available statistical properties. Each row in this window corresponds to one or more columns in the statistical table. Only ticked items show in the statistical table. You can use this window to quickly adjust visible columns to reduce clutter in statistical tables.
The combo box at the top of the window lists some pre-defined column selections - All, Basic, Positional, History. If you make a custom selection by ticking and unticking appropriate table rows the save button will activate. Press the button to create a custom named column selection that will be then available in the combo box. This way you can create several column selections and switch between them very quickly using the combo box. To remove a custom column selection click the delete button next to the combo box.
![]() You can tick/untick multiple items with a single click. First highlight the rows you wish to (un)tick - you can press Ctrl+A to select all rows. Then tick/untick one of the selected rows - all of the selected rows will be ticked/unticked as well.
You can tick/untick multiple items with a single click. First highlight the rows you wish to (un)tick - you can press Ctrl+A to select all rows. Then tick/untick one of the selected rows - all of the selected rows will be ticked/unticked as well.
You can even change the order of columns and thus more easily compare various statistical properties with each other. To change the order of columns in statistical table simply drag and drop table rows into desired position.
See also Statistics Options.
This screen shows in Custom Analyzer window when there was an error while accessing analyzed data. Click menu View - Application Log and check application messages in Output window for possible problems. Also make sure you are using the latest version of Expert Lotto - click menu Help - Check for updates.
If the problem persists even in the latest version of the application, please contact Expert Lotto support team.
This window opens after clicking either Add New or Modify button in Panel Layouts window.
The window shows a table where each cell represents a single box in the ticket panel layout. The count of rows and columns is adjustable using appropriate spinner fields.
Select one or more table cell using your mouse and press Delete key to clear their numbers. Click into any cell and type the number that should be showing at the location in the ticket panel. The numbers can be entered in any order and not every cells must contain a number.
Enter a short descriptive name into Name field. This name will be showing in Layouts combo box in Ticket Panel window.
Note: Custom ticket panel layout can show main ticket numbers only, Powerball numbers will not show in any custom ticket panel layout.
Expert Lotto is a universal lottery software suitable for any numerical lottery. Expert Lotto supports:
There are many features in Expert Lotto to help you with the selection of numbers for the next draw and to improve your bet/win balance. The results of all functions are always reproducible because there is solid math behind every Expert Lotto feature. The application is not a black box providing different results each time the same function is used.
This documentation provides detailed description and explanation of all Expert Lotto features. Just press F1 key at any time while working with Expert Lotto to see how to use the current application screen or window in these help pages. It is strongly recommended to read through the Getting Started section of this manual before using Expert Lotto. Also visit our online tutorials where you can find practical, step-by-step instructions for some of the most common tasks. You can also share your experience with other Expert Lotto users in our discussion board.
Menu Tools - Lottery - Edit starts Edit Lottery Setting wizard where you can modify some of settings of currently opened lottery.
You can adjust the following lottery settings:
You cannot change the lottery type, e.g. switch from Jackpot to Powerball, draw date type, number pool size and the count of main and bonus numbers.
When the wizard is finished a new lottery will be created. The new lottery will have the same set of past winning numbers as the current lottery.
There are several steps when editing lottery settings:
Enter the name for the modified lottery, short description and lottery web site address. This info will show in application's About box (menu Help - About - Lottery).
Make sure that these settings actually match the draw schedule of your lottery. Otherwise you might have problems when importing past winning numbers or when updating your winning numbers database online.
Choose which combinations of matching
numbers are the winning ones by ticking the Is Winning? column.
Highlight any matching combination in the table and use Move Up and Move Down buttons to move it up or down in the list.
You can also
change the default prize names in the Prize column by double-clicking
the appropriate table cell and typing a new name.
Define the layout of numbers in a ticket
panel to match the paper playslip. If you are creating a powerball
lottery you must define panel layout for additional pool(s) as well.
Although these settings are not mandatory and you can keep wizard's default values there is a filter and statistics that are based on ticket panel layout.
Click button Browse to select the folder the modified lottery will be stored in. The selected folder must be empty.
Click button Finish to finish the Edit Lottery wizard. The wizard will create a new lottery using the settings you've just modified and the same winning numbers database as the current lottery. The current lottery with old settings still remains on your hard disk. If you are certain you will never need the old lottery setup you can simply remove the older lottery folder.
Read more on lottery management here.
Draw simulation is available in Latest History window and Summary History window. It calculates and collects History sums for a selected set of number combinations and presents them as a histogram table and chart. The histogram then shows what is statistically most likely to happen with History values in the next draw.
Click button
to open
Simulation Draws window to select the number combinations to be used as
simulated winning numbers and start the draw simulation process.
When the draw simulation is finished, the results are presented in a table in the upper half of the window. Each table row contains the results for a single History Level. The tables columns are:
![]() Toggle button
to show draw simulation results as differences from the latest draw, toggle
button to show simulation results as absolute sum values.
Toggle button
to show draw simulation results as differences from the latest draw, toggle
button to show simulation results as absolute sum values.
![]() Click any column header to sort the table in ascending or descending order.
Click any column header to sort the table in ascending or descending order.
The lower part of the window is histogram chart showing draw simulation results for selected Level. A section of that chart is automatically transferred to Simulation hint in My Estimates window:
The figure below shows the simulation histogram for Expert Lotto 6/49 Demo lottery generated from all possible combinations:
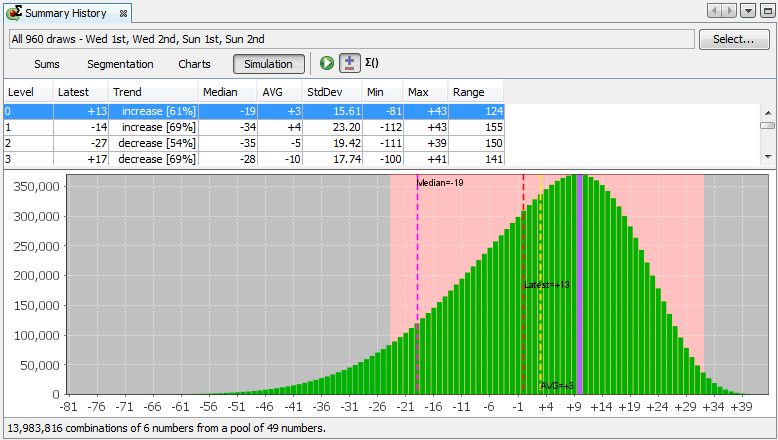
The most frequent value is +10 which was simulated 371,183 times. Let's assume that occurrence tresholds in History settings window are set to 15% and 10% respectively.
Fifteen percent of 371,183 is approximately 55,677. So the range estimate will include differences that were simulated at least 55,677 times, that is differences greater than -27.
Ten percent of 371,183 is approximately 37,118. So the range estimate will include differences that were simulated at most 37,118 times, that is differences lower than +33.
Pink background in the figure above highlights the section of simulation histogram that is automatically transferred to My Estimates window for occurrence thresholds set to 15% and 10% respectively.
You can refine the hints in My Estimates window by zooming a section of the histogram chart:
![]() Blue bar in the histogram chart denotes the most frequent sum or difference from the simulation results.
Blue bar in the histogram chart denotes the most frequent sum or difference from the simulation results.
![]() Black dotted line in the histogram chart denotes the sum or difference corresponding to the current what-if numbers.
Black dotted line in the histogram chart denotes the sum or difference corresponding to the current what-if numbers.
![]() The whole histogram is projected into History Sum and History Differences charts as a grey gradient bar. Darker color denotes values with higher occurrences, lighter colors denote History values occurring only very seldom in the simulation results.
The whole histogram is projected into History Sum and History Differences charts as a grey gradient bar. Darker color denotes values with higher occurrences, lighter colors denote History values occurring only very seldom in the simulation results.
The status bar at the bottom of the window shows the count of tickets that were used for draw simulation and ticket filter applied on those tickets (if any).
![]() See also History Level Synchronization.
See also History Level Synchronization.
Filter group consists of ticket filters and/or other filter groups thus forming the hierarchy of a Complex Filter. Filter group settings define how many of its sub-filters must accept a ticket so that the whole filter group accepts a ticket.
Let's assume that filter group consists of three filters called filter A, filter B and filter C (in this order).
This window pops up when invoking an action, which requires exclusive access to the tickets in the Package and some long running tasks are reading the Package contents.
It is very difficult to make correct predictions of History ranges in all levels. However most of the time there is at least one level where you can be sure your predictions will be correct in the next draw. In such cases this tool will help you estimate ranges in other levels or validate your existing estimates in other levels.
First open My Estimates window and make estimates for one or more levels. It should be the levels you are most comfortable with - for example because of the shape of appropriate History chart or because the History value (does not) repeat from previous draw etc.
Then select those estimates in My Estimates window and click ![]() button in its toolbar to open Draw Simulation window.
button in its toolbar to open Draw Simulation window.
Select the tickets to use as simulated draws by clicking Select button. It is recommended to use the full wheel of all possible combinations. Make sure you have the correct selection of past draws.
The window shows all selected levels and their History ranges. If you selected more than one History level you can use controls at the bottom of the window to relax the filtering condition as necessary.
Click Run Simulation button to start the draw simulation process. You can track the progress of the simulation at the bottom of the main window.
The simulator will filter out all simulation tickets that do not produce History values within the ranges of selected Levels and calculate History values from the accepted tickets. The results will then show the minimum and maximum History sum found thus defining the maximum possible interval. You should check that your estimates in other levels are within that interval.
The results are available in My Estimates window and in History charts where they show as a histogram at the end of the chart. The darker areas of the histogram represent History values that were found most frequently during the simulation, brighter areas of the histogram denote History values that appeared very seldom during the simulation process.
The goal of all lottery strategies is the prediction of winning numbers that will hit in the next draw. Lottery players in most cases search for the most frequent or the least frequent numbers, then examine the latest winning numbers and/or their statistical properties trying to guess what is the most likely to happen in the next draw.
Expert Lotto has built-in tool which automates the prediction process to some extent. The application will search through selected past draws and compare them with the latest winning numbers to predict the numbers and statistical properties that are expected in the coming draw. As all other Expert Lotto features, the predictions are based on solid math. With the same input data and the same settings the predictor will always provide the same, reproducible results. There is no magical black-box spitting out different numbers each time it is clicked. Expert Lotto predictor is based on pattern matching algorithm which is widely used in many other computer-assisted fields – facial recognition, statistical data analysis, signal processing etc.
The following table lists 15 latest draws in Expert Lotto 6/49 lottery in descending order:
| Date | Position 1 | Position 2 | Position 3 | Position 4 | Position 5 | Position 6 | Bonus |
| 2010/28 Sun 2nd | 23 | 29 | 36 | 42 | 44 | 47 | 7 |
| 2010/28 Sun 1st | 6 | 13 | 14 | 19 | 41 | 42 | 29 |
| 2010/28 Wed 2nd | 2 | 13 | 16 | 17 | 25 | 40 | 27 |
| 2010/28 Wed 1st | 16 | 18 | 22 | 23 | 28 | 29 | 24 |
| 2010/27 Sun 2nd | 1 | 6 | 12 | 24 | 32 | 41 | 44 |
| 2010/27 Sun 1st | 2 | 15 | 22 | 29 | 30 | 37 | 42 |
| 2010/27 Wed 2nd | 20 | 23 | 25 | 30 | 33 | 35 | 7 |
| 2010/27 Wed 1st | 8 | 11 | 19 | 26 | 48 | 49 | 18 |
| 2010/26 Sun 2nd | 8 | 11 | 18 | 32 | 36 | 38 | 6 |
| 2010/26 Sun 1st | 5 | 6 | 11 | 31 | 40 | 43 | 32 |
| 2010/26 Wed 2nd | 4 | 18 | 26 | 33 | 35 | 47 | 11 |
| 2010/26 Wed 1st | 5 | 12 | 25 | 31 | 44 | 46 | 33 |
| 2010/25 Sun 2nd | 10 | 15 | 28 | 30 | 36 | 43 | 35 |
| 2010/25 Sun 1st | 16 | 21 | 24 | 25 | 35 | 46 | 47 |
| 2010/25 Wed 2nd | 9 | 12 | 23 | 34 | 39 | 49 | 24 |
The latest three numbers at the second ticket position are: 13, 13 and 29. Those three numbers form the latest pattern. The pattern size is 3 as it consists of three numbers.
Now we will search the past winning numbers at the second ticket position and look for a similar pattern. The table above shows that the best matching past pattern can be found in draws 2010/26 Sun 2nd to 2010/27 Wed 2nd. The past winning numbers are 11, 11 and 23. The following draw is 2010/27 Sun 1st where the second winning number is 15. So the prediction for the coming draw 2010/29 Wed 1st is number 15 at the second ticket position.
Let's verify our prediction in Expert Lotto:
Winning Number Properties window opens and its table will show the following value in Position 2 column:
The downward red triangle indicates that the predicted trend is decrease in the next draw and the number predicted for the second ticket position is 15. See below for more instructions how to interpret the prediction results.
If we let the predictor scan the whole database of past winning numbers then it will find the best matching pattern in draws 2006/23 Sun 2nd to 2006/24 Wed 2nd. Their winning numbers are 12, 16 and 30. The following winning number at the second ticket position is 11. That means the predicted trend is again decrease and the predicted value is 11.
What happens if we increase the pattern size from three numbers to 10 numbers? The latest pattern is then 6,11,11,23,15,6,18,13,13,29. When displayed in a chart the numbers look like this:
The predictor will find best matching pattern in draws 2008/45 Sun 2nd to 2008/48 Wed 1st where the winning numbers are 9,20,13,21,12,8,15,15,4,27. The numbers in a chart look like this:
The following number at the second ticket position is again 11 (draw 2008/48 Wed 2nd). That means the predicted trend is again decrease and the predicted value is 11.
If you compare the chart of the latest pattern and the chart of the found matching pattern above, you can see that the match is actually very loose. But it is still the best match the predictor can find in the whole database of past winning numbers. We cannot realistically expect to find a sequence of past winning numbers that is exactly the same as the ten latest draws. The longer the patterns are the less similarities between the latest pattern and the best matching pattern. So how to select the optimal pattern size?
In the examples above we used pattern size 3 which gave us predicted value 11 and pattern size 10 also with predicted value 11. In this case we have the same results. But what if the predicted values or even the predicted trends were different? How to tell which prediction is more credible?
The predictor runs a series of tests and selects the best pattern size automatically. Option Latest draws for back-testing in prediction settings screen defines how deep this back-testing is. If the prediction settings are for example Pattern size min 3, max 15, Latest draws for back-testing: 10 then the predictor will make 130 predictions to pick the optimal pattern size. It will start with pattern size 3, make prediction for draw 2010/28 Sun 1st and compare the predicted trend with actual value from the following draw 2010/28 Sun 2nd. Then it will make prediction for draw 2010/28 Wed 2nd and compare the predicted trend with the value from the following draw 2010/28 Sun 1st. There will be 10 such testing predictions up to draw 2010/26 Wed 2nd. The predictor will count how many predicted trends were correct when compared with the following draws.
Then the pattern size will increase to four and the predictor will make another ten testing predictions for ten latest draws. The count of correct trend predictions is noted. The pattern size is increased to five and the testing runs are repeated. This continues up to pattern size 15 as selected in prediction settings. Then the predictor will select the pattern size that had the highest count of correct trend predictions. This optimal pattern size is then used to make the actual prediction for the latest draw 2010/28 Sun 2nd. In this case the best pattern size is 3 because seven trend predictions were correct during back-testing. When using pattern size 10, there were only 4 valid trend predictions out of the ten back-test runs.
![]() Hover mouse cursor above table cell with prediction result to see a tooltip with the best pattern size and the count of back-test predictions that were correct.
Hover mouse cursor above table cell with prediction result to see a tooltip with the best pattern size and the count of back-test predictions that were correct.
With option Back-testing compares values you can modify the prediction algorithm to select the pattern size that predicts values which are closest to the actual values when back-testing.
![]() Some lottery operators publish additional details about each draw – which set of balls has been used, which drawing machine etc. If the balls and/or machines are being changed at regular intervals it probably makes sense to use pattern sizes shorter than the interval between such changes.
Some lottery operators publish additional details about each draw – which set of balls has been used, which drawing machine etc. If the balls and/or machines are being changed at regular intervals it probably makes sense to use pattern sizes shorter than the interval between such changes.
The predictor has two modes of pattern matching. It can match either absolute values in a sequence of numbers as demonstrated above or it can match number differences instead. Let's have the following sequence of numbers:
31,35,13,20,15,5,2,10,4,25,3,10,5
Let's consider the last three numbers as the latest pattern: 3,10,5. When matching absolute values then the best matching pattern is 2,10,4 followed by number 45. However when matching number differences then the best matching pattern is 13,20,15 followed by number 5.
The same sequence of numbers expressed as value differences looks like this:
+31,+4,-22,+7,-5,-10,-3,+8,-6,+21,-22,+7,-5
So the latest pattern has changed to -22,+7,-5 and the best matching pattern is -22,+7,-5 corresponding to numbers 13,20,15 followed by number 5. So when matching differences the matching pattern must have the same shape (the order of increasing/decreasing values) as the latest pattern however all its values may be shifted up or down when compared with the latest pattern.
Now we will repeat the prediction for the second ticket number and use differences pattern matching instead of absolute values:
The best matching pattern are draws 2006/20 Wed 1st to 2006/20 Sun 1st with numbers 4,4,21, which translate to differences -3,0,+17. The following difference is -8.
The differences of the latest pattern are -5,0,+16. The predicted value is
29 – abs( -8 * (abs(-5/-3) + abs(0/0) + abs(16/17)) / 3 * ) = 29 – 9.62 = 19.
Note that the predicted value includes correction which takes into account the differences between the latest and best matching patterns.
The same prediction with pattern size 10 will find the best matching pattern at draws 2009/24 Wed 1st to 2009/26 Wed 2nd where the numbers are 5,15,15,20,13,10,14,9,6,11 and the following number is 21. The prediction is increase to 46. This prediction is conflicting with the prediction with pattern size 3. However this prediction is a bit less credible as the back-testing passed in 5 out of 10 back test runs, while pattern size 3 predictions had 6 valid trend predictions during back-testing.
![]() It is recommended to use differences pattern matching especially for predictions of derived values like History sums and differences. Absolute values pattern matching is suitable for values with a small range, for example sum root, odd/even or the actual winning numbers at individual ticket positions.
It is recommended to use differences pattern matching especially for predictions of derived values like History sums and differences. Absolute values pattern matching is suitable for values with a small range, for example sum root, odd/even or the actual winning numbers at individual ticket positions.
Pattern matching slider in Predictions Options window adjusts the weights of individual numbers when the patterns are being compared. When the slider is moved fully to the right then the pattern matching is strict and each number has the same weight.
Moving slider to the left relaxes the pattern matching as the numbers of the patterns being matched have lower weight when comparing them together. If the latest pattern is for example 6,11,11,23,15,6,18,13,13,29 then strict pattern matching may find for example pattern 9,20,13,21,12,8,15,15,4,27. With relaxed matching the best found pattern will be for example 33,16,25,14,31,11,18,12,16,30. As you can see the first few numbers of the best matching pattern match the latest pattern very loosely only. In both cases the predicted value is 10 however with relaxed pattern matching there were 9 valid back-test predictions while the strict matching produced only 7 valid predictions when back-testing on 15 latest draws. Relaxed pattern matching is recommend only when using larger pattern sizes (10 and more).
Predictions are available either from menu Winning Numbers – Predictions or from menu History – Predictions. Both menu commands start Predictions wizard.
You can track the progress of the prediction process at the lower right corner of the main window. When the process is finished the prediction results are available in Winning Numbers Properties and Winning Numbers Charts windows or in Summary History window under Sums and Charts tabs.
![]() – blue triangle indicates that the predicted trend is increase. That means the next value is expected to be greater than the latest value. The actual predicted value is also available.
– blue triangle indicates that the predicted trend is increase. That means the next value is expected to be greater than the latest value. The actual predicted value is also available.
![]() – red triangle indicates that the predicted trend is decrease. That means the next value is expected to be lower than the latest value.
– red triangle indicates that the predicted trend is decrease. That means the next value is expected to be lower than the latest value.
![]() – when both red and blue triangles are present in table cell then the predicted trend is level. That means the next value is expected to be the same as the latest value.
– when both red and blue triangles are present in table cell then the predicted trend is level. That means the next value is expected to be the same as the latest value.
Note: The predictions algorithm operates just with a sequence of numbers. In some cases the predicted value can be lower or higher than the minimum or maximum possible values. In such cases you should consider the predicted trend only.
Value n/a in prediction results means it was not possible to make valid prediction. Usually because there are not enough data to select the matching pattern.
![]() The predicted trend should be the main indicator when estimating values for the coming draw. The actual predicted value should be only a hint showing how big the predicted increase or decrease is.
The predicted trend should be the main indicator when estimating values for the coming draw. The actual predicted value should be only a hint showing how big the predicted increase or decrease is.
Hover mouse cursor over predicted cell to see a tooltip with additional information regarding the prediction. You can see how many back-test predictions were correct and the pattern size that has been used for predictions.
![]() It is recommended to ignore predictions with low percentage of successful back-test by entering required percentage of successful back-test into the last input field.
It is recommended to ignore predictions with low percentage of successful back-test by entering required percentage of successful back-test into the last input field.
Detailed information about the prediction process is available in Application Log. When the predictions are finished click menu View – Application Log. The Output window then shows the following details for each predicted value. For example:
Position 2 – name of the predicted value. In this case it is the winning number at the second ticket position.
Trend prediction: Decrease – predicted trend (increase/decrease/level)
Predicted value: 10.0 – the actual predicted value. Please note that all values are zero-based so the predicted winning number is 11.
Best pattern size: 5 – the pattern size used for the prediction.
Best weight: 1.0 – the weight used for pattern matching. The weight is always 1.0 unless relaxed pattern matching has been used.
Matching pattern: [10.0 17.0 11.0 15.0 29.0] => 10.0 – the best matching pattern found. In the case the best pattern are numbers 11,18,12,16,30. The number following this pattern is 11.
Marker: 94 – the position in the sequence of numbers where the best matching pattern has been found. Value 0 means the oldest draw.
Back-tests: 15 – the count of back tests that have been carried out to validate the pattern size.
Mean Square Error: 107.66666666666667 – shows how much the back-test prediction values differ from the actual values. The lower MSE the more accurate the back-test prediction values are.
Mean Absolute Percentage Error: 0.6399601052542229 - MAPE indicator also compares the back-test predictions with the actual values.
Valid trend predictions: 6 (40.0%) - how any back tests produced correct trend prediction.
See also Trend Predictions filter.
There is one sure way to win the lottery Jackpot - play all possible combinations. However the payouts are never so big to return the cost of such a huge bet, not to mention the time needed to fill out so many playslips. Most lottery players have limited betting budget so they play a small wheel only. Depending on your lottery strategy you can download a wheel from internet or create a new one from scratch by filtering down the whole set of all possible combinations. The filtering process excludes combinations - tickets - that are not expected to win in the next draw. It is either a manual process of going through the tickets one by one and removing those you don't like or it can be done in bulk by applying ticket filters.
Ticket filter is a simple yes/no condition. A filter accepts a ticket when the ticket numbers meet filter's condition, filter rejects a ticket if the ticket doesn't meet filter's condition. The filter condition can be either a simple check for desired ratio of odd and even numbers or the filter can compare ticket numbers with past draws or it can be a complex hierarchy of other simple filters.
To filter tickets in the Package, click menu Package - Reduce - Filter Tickets. Then select the filter you wish to apply to Package tickets and click Select button to open the selected filter. A new window opens where you can enter the settings of selected filter. At the bottom of the filter window there are buttons to run the filter:
To revert the filtering results, click menu Edit - Undo to return the Package to the same state as before filtering.
![]() When OK or Apply button is clicked in the filter window
then the current filter settings are remembered and reused as the
default settings when the filter is opened again.
When OK or Apply button is clicked in the filter window
then the current filter settings are remembered and reused as the
default settings when the filter is opened again.
![]() If you play a lottery that draws one or more bonus numbers from the same pool as the main numbers it is possible to modify the selection of past draws in filter window to merge the bonus number(s) into the main numbers. This option is available only when filtering Package tickets using a single filter. It isn't possible to merge bonus numbers with main numbers in Complex Filter window.
If you play a lottery that draws one or more bonus numbers from the same pool as the main numbers it is possible to modify the selection of past draws in filter window to merge the bonus number(s) into the main numbers. This option is available only when filtering Package tickets using a single filter. It isn't possible to merge bonus numbers with main numbers in Complex Filter window.
If you are connecting to internet through a proxy server you can use this options panel to enter proxy server address and port. However in most cases you can leave option Use System Proxy Settings on and the application will try to detect and reuse proxy settings from your operating system.
Important: Entering invalid proxy settings may disable some application features that rely on internet connection - checking for application updates, online update of winning numbers or creation of pre-defined lotteries.
Note: This options panel opens from menu Tools - Options - General.
These statistics show the occurrences of all possible number triplets in analyzed tickets. In a x/49 the triplets are 1-2-3, 1-2-4, 1-2-5 and so on up to 46-48-49 and 47-48-49.
See also Consecutive Triplets statistics.
Summary Winnings window opens after clicking button Summary in Package Winnings window. It shows the summary count of tickets winning any prize.
Column Payout shows the money payouts for given prize category. Double-click any field in that column to adjust the payouts. Column Total shows the break down of winnings per prize category.
Fields below the table show the total winnings, the total cost of the bet and net profit. The cost of single bet is adjustable using menu Tools - Options - Miscellaneous - Payouts.
Menu Tools - Lottery - Resize starts Resize Lottery wizard wizard where you can adjust the count of main ticket numbers and/or merge bonus number(s) into main numbers.
When the wizard is finished a new lottery will be created. The new lottery will have the same set of past winning numbers as the current lottery.
There are several steps when resizing a lottery:
A brief description of the wizard window.
Tick main ticket positions you wish to use in the new lottery.
If the current lottery draws any bonus or powerball numbers there are tick boxes to include the bonus numbers in the new lottery. If the bonus number comes from the same pool as the main numbers you can merge that bonus into main numbers.
You can also select how many main numbers Package tickets will have in the new modified lottery.
A table at the bottom of the wizard window shows how past winning numbers draws will look like in the new modified lottery.
Choose which combinations of matching
numbers are the winning ones by ticking the Is Winning? column.
Highlight any matching combination in the table and use Move Up and Move Down buttons to move it up or down in the list.
You can also
change the default prize names in the Prize column by double-clicking
the appropriate table cell and typing a new name.
Enter the name of the modified lottery, short description and lottery web site address. This info will show in application's About box (menu Help - About - Lottery).
Click button Browse to select the folder the modified lottery will be stored in. The selected folder must be empty.
Click button Finish to finish the Resize Lottery wizard. The wizard will create a new lottery using the settings you've just modified and the same winning numbers database as the current lottery. The current lottery with old settings still remains on your hard disk.
Read more on lottery management here.
These statistics show the occurrences of all possible number pairs in analyzed tickets. In a x/49 lottery the pairs are 1-2, 1-3, 1-4 and so on up to 47-48 and 48-49.
For example in Expert Lotto 6/49 Demo Lottery the 10 latest draws are:
| 2010/28 Sun 2nd | 23 | 29 | 36 | 42 | 44 | 47 | [07] |
| 2010/28 Sun 1st | 06 | 13 | 14 | 19 | 41 | 42 | [29] |
| 2010/28 Wed 2nd | 02 | 13 | 16 | 17 | 25 | 40 | [27] |
| 2010/28 Wed 1st | 16 | 18 | 22 | 23 | 28 | 29 | [24] |
| 2010/27 Sun 2nd | 01 | 06 | 12 | 24 | 32 | 41 | [44] |
| 2010/27 Sun 1st | 02 | 15 | 22 | 29 | 30 | 37 | [42] |
| 2010/27 Wed 2nd | 20 | 23 | 25 | 30 | 33 | 35 | [07] |
| 2010/27 Wed 1st | 08 | 11 | 19 | 26 | 48 | 49 | [18] |
| 2010/26 Sun 2nd | 08 | 11 | 18 | 32 | 36 | 38 | [06] |
| 2010/26 Sun 1st | 05 | 06 | 11 | 31 | 40 | 43 | [32] |
Pairs analysis shows that the draws don't contain pair 1-2. Also pairs
1-3, 1-4 and 1-5 are not found in analyzed tickets. Pair 1-6 occurs
just once (see cells with blue background in the table above).
For example pair 22-29 has been found twice in the analyzed tickets
(see cells with orange background) so the analyzer table shows
Occurrence value of 2 in the corresponding table row.
See also Consecutive Pairs statistics.
This window opens from My Estimates window after clicking button in its toolbar. Use this feature to find the minimum and maximum possible History Sum values for the next draw:
Option Use as my estimates automatically enters the min/max values as current estimates into all unlocked Levels in My Estimates window.
![]() You should always calculate the absolute min/max ranges as the
first step of your lottery strategy when using History functions. For
example if the absolute minimum in Level 0 is 295 and the absolute
maximum in the same Level is 419 then there is no point estimating the
range for Level 0 to e.g. 420 to 440. There is no combination of pool
numbers that would produce a History Sum within that range. Also
estimating for example range of 405 to 425 is wrong. There are no
tickets to produce sum in the range of 420 to 425 so you are wasting a portion of your safety margin.
You should always calculate the absolute min/max ranges as the
first step of your lottery strategy when using History functions. For
example if the absolute minimum in Level 0 is 295 and the absolute
maximum in the same Level is 419 then there is no point estimating the
range for Level 0 to e.g. 420 to 440. There is no combination of pool
numbers that would produce a History Sum within that range. Also
estimating for example range of 405 to 425 is wrong. There are no
tickets to produce sum in the range of 420 to 425 so you are wasting a portion of your safety margin.
Remove Matching Tickets window opens after clicking Filter button at the bottom of Package Matrix window or Winning Numbers Matrix window.
Note: Filter button in Package Matrix window is enabled only when there are some tickets in the Package and one or more numbers are highlighted in matrix table header. Filter button in Winning Numbers Matrix window is enabled only when the table is showing one or more draws and some numbers are highlighted in matrix table header.
You can use this window to remove tickets/draws that contain selected count of highlighted numbers - tick appropriate check boxes in the filter window then press Remove Match In button.
Note:
Using this filter in Winning Numbers Matrix window does NOT remove any
entries from winning numbers database. The filtered draws are just
removed from the table only. You can make a new selection of past draws
by clicking Select button to list the removed draws in the table again.
On
the other hand filtering in Package Matrix window does remove filtered
tickets permanently from the Package. You can use menu command Edit -
Undo to revert the filtering.
Menu command File - Open File brings up a standard window for file selection where you can choose a file to open in Expert Lotto:
Note: You can also drag and drop a file into the main application window to open it in the same way as using menu command File - Open File.
This window is the first step when performing History draw simulation. The tickets selected in this window will be treated as winning numbers and their History values will be calculated and summarized in Draw Simulation table.
Click button Select in the upper part of the window to open popup menu to select the tickets for draw simulation. The content of the lower part of the window differs depending which window the simulation is started from.
Click button Run Simulation at the bottom of the window to start Draw Simulation.
Click menu History - Latest to open Latest History window, switch to
Segmentation mode and toggle Draw Simulation button. Then click button to open Simulation Draws window.
The lower part of the window contains controls to adjust segmentation filter settings. The filter will be applied to simulation tickets and the simulation results will be calculated only from tickets the filter accepts.
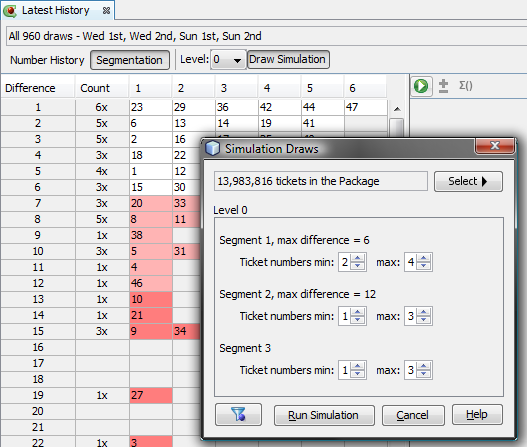
The example above invokes draw simulation for all possible number combinations in Expert Lotto 6/49 demo lottery. History values will be calculated only for tickets that have two to four numbers from Segment 1 in Level 0 AND one to three numbers from Segment 2 in Level 0 AND one to three numbers from Segment 3 in Level 0. All other tickets are discarded and don't affect simulation results.
Button
at
the bottom left corner of the window applies the segmentation filter on
tickets in the Package. The button is enabled only when the Package
isn't empty.
Click menu History - Summary to open Summary History window, switch to Simulation mode and click button to open Simulation Draws window.
There is Use filter check box at the lower part of the window. Tick the check box and click Select button to choose a filter to be applied to simulation tickets. Only tickets accepted by the filter will be used to calculate History values. Using a filter during Draw Simulation enables comparing simulation results of pre-filtered tickets with the simulation results of e.g. all possible number combinations.
Using a filter in Simulation Draws window is just a shortcut for the following steps:
This window opens after clicking Match Summary button at the bottom of Package Matrix window or Winning Numbers Matrix window. The table shows summary count of tickets that contain highlighted numbers. Column Match contains the count of highlighted numbers in a ticket, column Count shows the summary count of tickets in the Package or draws in the matrix table with the given count of highlighted numbers.
Note: Match Summary button in Package Matrix window is enabled only when there are some tickets in the Package and one or more numbers are highlighted in matrix table header. Match Summary button in Winning Numbers Matrix window is enabled only when the table is showing one or more draws and some numbers are highlighted in matrix table header.
Menu File - New - Lottery starts New Lottery Wizard where you can pick one of the ready-to-play lotteries or create a custom lottery. There are several steps when creating a new lottery:
Choose any lottery from the
list of lotteries that are
available at Expert Lotto web server. Click table header to sort the
list either by the country of origin or by the lottery name. When
hovering mouse cursor over any table row a short lottery description
pops up. Clicking button Next downloads the lottery and the wizard
continues with Step 9.
Note: Internet connection is required when Available lotteries option
is selected.
If you find out that the selected lottery is out-date, for example because the lottery rules have changed or because there are mistakes in lottery winning numbers database, please click Report obsolete lottery button to the right of the Available lotteries table. It will open an email window addressed to Expert Lotto support team where you can describe what is wrong with selected lottery. After receiving this email Expert Lotto team will attempt to address the problem in one of the next application updates.
If the lottery you want to play isn't listed in the Available lotteries table, click Create other lottery option and then choose button Next to continue with wizard's next step.
Enter lottery name, short description and lottery web site address. This info will show in application's About box (menu Help - About - Lottery).
When creating a Jackpot or
Keno lottery select option All
numbers from the same pool.
When setting up a Powerball lottery which draws main numbers from the
same pool and one or more powerball numbers from separate pool(s)
select option One or more additional numbers from a different pool.
To create a Pick 3 or Pick 4 lottery which draws each number from a
separate pool select the last option.
Note: The content of this wizard step differs according to lottery type selected in Step 3.
Enter the count of main
numbers into the first field. If you're setting up a Jackpot lottery
which draws bonus numbers enter their count into the next field, enter
zero into that field when creating a Keno lottery.
Next choose the lowest and highest number in the pool.
Jackpot lotteries draw the same count of main
numbers as the count of numbers marked on a playslip, Keno lotteries
draw more numbers than how many are marked on a playslip.
You can also choose whether the winning numbers in each draw are sorted
in ascending order or whether you want to keep them in the original
draw order.
The first part of this
wizard step is the same as for Jackpot lotteries but you must also
define the pool(s) for Powerball number(s).
If the lottery draws e.g. two powerball numbers from a pool of 35 then
enter "2" into bonus numbers field and select that Bonus 1 ranges from
1 to 35. Then click the combo box, pick Bonus 2 from the popup list and
also enter 1 to 35 into the pool range fields. You can pick any name
for the Powerball pool - Mega Ball, Extra Ball, Power Ball - to match
your lottery rules.
If the lottery draws e.g. two additional numbers from the same pool as
the main numbers and 1 powerball from a separate pool of 5 numbers then
enter "3" into bonus numbers fields.
Select the same pool range as the main number
pool range for Bonus 1 and Bonus 2. Then pick Bonus 3 and enter "1" and "5" into pool range
fields.
Select how many numbers are
drawn and the size of each number pool.
Note: There
are special matching rules for Pick 3 lotteries (e.g. 3-way box, front
pair etc) and for Pick 4 lotteries (e.g. 12-way box). Lotteries that
draw more than four numbers have only simplified ticket matching rules.
Choose how the date of each draw will look like:
Make sure that these settings actually match the draw schedule of your lottery. Otherwise you might have problems when importing past winning numbers or when updating your winning numbers database online.
Choose which combinations of matching
numbers are the winning ones by ticking the Is Winning? column.
Highlight any matching combination in the table and use Move Up and
Move Down buttons to move it up or down in the list.
You can also
change the default prize names in the Prize column by double-clicking
the appropriate table cell and typing a new name.
Define the layout of numbers in a ticket
panel to match the paper playslip. If you are creating a powerball
lottery you must define panel layout for additional pool(s) as well.
Although these settings are not mandatory and you can keep wizard's default values there is a filter and statistics that are based on ticket panel layout.
Click button Browse to select the folder the lottery will be stored in. The selected folder must be empty.
Click button Finish to finish the New Lottery Wizard and start playing the new lottery.
Read more on lottery management here.
See also Edit Lottery Settings wizard and Resize Lottery wizard.
This window opens after clicking Edit button in Ticket Panel window.
Note: Custom ticket panel layouts are available only in lotteries that draw all main numbers from the same pool.
The window lists custom ticket panel layouts that are available for the current lottery. Initially the window is showing the Default layout only. It is the layout that should match the layout of tick boxes on paper playslips.
When you are finished making changes to your ticket panel layouts click button Close to return to the Ticket Panel window. Then use its Layout combo box to display any of the new or modified panel layouts.
Chart window appears at several place in Expert Lotto. For example, it displays summary statistics as a bar chart, sequence of statistical properties for past draws in a line chart or the progress of History sums and differences.
Use toolbar buttons at the top of the chart window to customize the chart appearance:
Zoom - by default each chart shows the whole horizontal axis. You
can zoom any part of the axis by clicking into the chart and dragging
the mouse cursor to the right. To reset the zoom either click this
button or click the chart window and drag the mouse to the left. Zoom Out - increases the range of the Y value axis. Use this function when some of the chart points to not fit into chart window.
Range Tool - toggles adjustable chart ranges. There are two
sliders to the right of chart window highlighting a portion of the
vertical axis when toggled on. Use your mouse to move the sliders, hold
down CTRL key to move both sliders at the same time. Alternatively you
can enter chart ranges directly from keyboard into the spinner fields
at the top and at the bottom of the sliders.
Zoom Out - increases the range of the Y value axis. Use this function when some of the chart points to not fit into chart window.
Range Tool - toggles adjustable chart ranges. There are two
sliders to the right of chart window highlighting a portion of the
vertical axis when toggled on. Use your mouse to move the sliders, hold
down CTRL key to move both sliders at the same time. Alternatively you
can enter chart ranges directly from keyboard into the spinner fields
at the top and at the bottom of the sliders. Chart Options - opens a drop-down menu with the following options:
Average Value - displays a horizontal line in the chart which denotes the average value.
Chart Options - opens a drop-down menu with the following options:
Average Value - displays a horizontal line in the chart which denotes the average value. Median Value - displays a horizontal line in the chart denoting the median value.
 Linear Fit - toggles linear fit line in the chart. When this line
points up then it means the chart points have upwards trend, if the
line points down then chart points have decreasing trend.
Linear Fit - toggles linear fit line in the chart. When this line
points up then it means the chart points have upwards trend, if the
line points down then chart points have decreasing trend. Moving Average 1 to 3 - shows moving average lines which consists of a
series of average values calculated from several preceding chart
points. The count of points the moving is calculated from is adjustable
in Statistics and History preferences.
Moving Average 1 to 3 - shows moving average lines which consists of a
series of average values calculated from several preceding chart
points. The count of points the moving is calculated from is adjustable
in Statistics and History preferences. Single Y Scale - when a chart window shows more than one data set
this button can be used to harmonize all chart points to a single Y axis value range. This feature is neccessary for example when comparing Number movement data at various ticket positions.
More Y Axis - when a chart window shows more than one data set
this button can be used to toggle the display of additional vertical
axis.
Single Y Scale - when a chart window shows more than one data set
this button can be used to harmonize all chart points to a single Y axis value range. This feature is neccessary for example when comparing Number movement data at various ticket positions.
More Y Axis - when a chart window shows more than one data set
this button can be used to toggle the display of additional vertical
axis.![]() You can export any chart window to a JPEG or PNG file - click into the chart window first, then select menu File - Export. You will be prompted for file name the chart picture will be exported to. By default the exported images open automatically in the default application associated with image file types.
You can export any chart window to a JPEG or PNG file - click into the chart window first, then select menu File - Export. You will be prompted for file name the chart picture will be exported to. By default the exported images open automatically in the default application associated with image file types.
This wizard window opens after clicking ![]() button in statistical analyzer toolbar.
button in statistical analyzer toolbar.
The application user interface lets you display draw interval details for a single analyzer table row only. If you want to see draw intervals for all table rows you must export the data in CSV or MS Excel file first.
You can export the data either as a summary report that shows draw intervals only or you can create a per-draw report which includes draw dates and list draw intervals for each draw.
The summary report will look like the table below:
| Ticket Numbers | ||||||||||||||
| 1 | 1 | 6 | 9 | 1 | 4 | 11 | 5 | |||||||
| 2 | 2 | 12 | 2 | 8 | 17 | 3 | 3 | |||||||
| 3 | 1 | 3 | 2 | 6 | 1 | 1 | 1 | 2 | 2 | 22 | ||||
| 4 | 2 | 17 | 6 | 1 | 13 | 11 | ||||||||
| 5 | 3 | 18 | 7 | 8 | 2 | 10 | ||||||||
| 6 | 20 | 11 | 6 | 5 | 3 | 2 | ||||||||
| 7 | 7 | 3 | 25 | |||||||||||
| 8 | 6 | 16 | 8 | 8 | 1 | 8 | ||||||||
| 9 | 12 | 9 | 14 | 15 | ||||||||||
| 10 | 5 | 19 | 13 | |||||||||||
| 11 | 10 | 10 | 11 | 8 | 1 | 1 | 8 | |||||||
| 12 | 10 | 4 | 2 | 7 | 2 | 2 | 2 | 3 | 7 | 5 | ||||
| 13 | 22 | 2 | 2 | 19 | 1 | 2 | ||||||||
| 14 | 11 | 20 | 2 | |||||||||||
| 15 | 7 | 6 | ||||||||||||
| 16 | 7 | 29 | 10 | 1 | 3 | |||||||||
| 17 | 8 | 3 | 2 | 28 | 3 | |||||||||
| 18 | 23 | 16 | 2 | 5 | 4 | |||||||||
| 19 | 5 | 8 | 3 | 1 | 4 | 10 | 6 | 2 | ||||||
| 20 | 4 | 12 | 1 | 2 | 4 | 16 | 7 | |||||||
| 21 | ||||||||||||||
| 22 | 6 | 4 | 12 | 11 | 10 | 2 | 4 | |||||||
| 23 | 1 | 6 | 3 | 8 | 1 | 4 | 2 | 1 | 5 | 2 | 8 | 3 | 3 | 1 |
| 24 | 3 | 2 | 13 | 5 | 2 | 9 | 5 | |||||||
| 25 | 4 | 3 | 3 | 7 | 1 | 5 | 5 | 2 | 5 | 4 | 3 | |||
| 26 | 6 | 2 | 29 | 3 | 8 | |||||||||
| 27 | 6 | 4 | 2 | 6 | 1 | 19 | ||||||||
| 28 | 16 | 7 | 5 | 9 | 4 | |||||||||
| 29 | 3 | 17 | 6 | 12 | 2 | 3 | 1 | |||||||
| 30 | 1 | 5 | 1 | 3 | 3 | 1 | 2 | 15 | 6 | 1 | 6 | |||
| 31 | 5 | 5 | 7 | 7 | 9 | 5 | 2 | 10 | ||||||
| 32 | 13 | 8 | 5 | 5 | 9 | 4 | 5 | |||||||
| 33 | 25 | 1 | 1 | 8 | 4 | 7 | ||||||||
| 34 | 15 | 3 | 6 | 8 | 1 | 15 | ||||||||
| 35 | 2 | 4 | 1 | 5 | 18 | 5 | 3 | 4 | 7 | |||||
| 36 | 3 | 4 | 4 | 18 | 4 | 8 | 1 | |||||||
| 37 | 11 | 3 | 15 | 11 | 6 | |||||||||
| 38 | 2 | 5 | 12 | 12 | 9 | |||||||||
| 39 | 1 | 2 | 23 | 2 | 3 | 15 | ||||||||
| 40 | 4 | 6 | 5 | 15 | 6 | 7 | 3 | |||||||
| 41 | 3 | 18 | 14 | 3 | 2 | |||||||||
| 42 | 18 | 19 | 1 | 1 | ||||||||||
| 43 | 16 | 3 | 10 | |||||||||||
| 44 | 3 | 6 | 8 | 14 | 11 | 1 | ||||||||
| 45 | 11 | 1 | 34 | |||||||||||
| 46 | 1 | 5 | 3 | 27 | 2 | 12 | ||||||||
| 47 | 1 | 12 | 21 | 10 | 1 | |||||||||
| 48 | 2 | 11 | 13 | 1 | 2 | 12 | 8 | |||||||
| 49 | 13 | 15 | 2 | 7 | 8 |
The first column lists the pool numbers, the following columns show the draw intervals of given pool number in the latest 50 draws.
The detailed per-draw report will look like the table below:
| 0:6 | 1:5 | 2:4 | 3:3 | 4:2 | 5:1 | 6:0 | |
| 2010/26 Sun 1st | 1 | 1 | 1 | 1 | 1 | 1 | 1 |
| 2010/26 Sun 2nd | 2 | 1 | 2 | 2 | 2 | 2 | 2 |
| 2010/27 Wed 1st | 3 | 2 | 3 | 1 | 3 | 3 | 3 |
| 2010/27 Wed 2nd | 4 | 3 | 4 | 2 | 1 | 4 | 4 |
| 2010/27 Sun 1st | 5 | 4 | 5 | 1 | 2 | 5 | 5 |
| 2010/27 Sun 2nd | 6 | 5 | 1 | 2 | 3 | 6 | 6 |
| 2010/28 Wed 1st | 7 | 6 | 1 | 3 | 4 | 7 | 7 |
| 2010/28 Wed 2nd | 8 | 7 | 2 | 1 | 5 | 8 | 8 |
| 2010/28 Sun 1st | 9 | 8 | 3 | 1 | 6 | 9 | 9 |
| 2010/28 Sun 2nd | 10 | 9 | 4 | 1 | 7 | 10 | 10 |
The table header lists all possible combinations of odd and even numbers. The first table column are the dates of the latest ten draws. Cell values show the draw interval of the given odd/even combinations and the given draw.
From the table above you can see for example that the odd/even ratio 3:3 hit in the very latest draw (its draw interval is 1). Ratios 0:6, 5:1 and 6:0 never hit in the latest ten draws.
Filters window opens from menu Tools - Filters and lists all filters available for current lottery. You can drag and drop filters from this window into Complex Filter designer or you can double-click any filter to filter tickets in the Package. Package filtering is enabled only when the Package isn't empty.
You can reorganize the filters tree by dragging and dropping filters into different categories. To create a new filter category, right-click in the Filters window and select New Category from the popup menu. To remove a filter or category from the list, right-click the filter/category and select Delete from the popup menu. Select Reset Filters in the popup menu to restore all deleted filters.
You can add saved Complex Filters to the Filters window by invoking Add Filter Reference from window's popup menu. This way you can conveniently access your frequently used Complex Filters.
Note: Filter labeled From file provides access to Complex Filters on your disk. When dropped to a Complex Filter window or when double-clicked for Package filtering it first opens a file browser window to select Complex Filter file(s) to use.
![]() A little star in filter icon denotes filters that you haven't used yet or filters that were added in the latest application update.
A little star in filter icon denotes filters that you haven't used yet or filters that were added in the latest application update.
This window opens up to select past draws from your winning numbers database. For example after clicking Select button in Winning Numbers Table window.
Option Jackpot Winners Only further restricts the draw selection to include only draws in which some lottery player hit the Jackpot (1st prize). This option is available only when you mark one or more draws as Jackpot winners either when adding past draws or when managing your winning numbers database. Jackpot winning draws show a dollar ($) sign in their draw date when displayed in various application tables and lists.
Additionally you can use check boxes at the bottom of the window to further restrict the draw selection. For example select Saturday draws only or choose evening draws only. The check boxes depend on the draw schedule of the current lottery.
![]() A message at the bottom of this window indicates how many draws will be selected with the current settings.
A message at the bottom of this window indicates how many draws will be selected with the current settings.
If you play a lottery that draws one or more bonus numbers from the same pool as the main numbers this window may offer another option to include the bonus number(s) into the main numbers.
For example when playing Expert Lotto 6/49 demo lottery you can click Select button in Winning Numbers Properties window and tick option Merge bonus to main numbers. The statistical table will show selected past draws as if seven main numbers were drawn and the bonus number will be sorted into appropriate position in the main numbers. Also all the statistical properties will be recalculated for the seven main numbers so you will see for example odd/even ratio of e.g. 4:3.
Press OK button to confirm your selection, press Cancel to revert your changes.
See also Cut-off Draw Date and Draw Date Pre-Filter.
Select Filter window opens from menu Package - Reduce - Filter Tickets or when Add filter button is clicked in Complex Filter designer and shows the list of all filters available for the current lottery. Click any filter in the list and then press Select button to start Package filtering or to add the selected filter to a Complex Filter. You can also double-click the filter to select it.
The filters in this window can be customized the same ways as in the Filters window. However drag and drop isn't support in this window.
Button Create New at the bottom of this window opens a new Complex Filter window where you can design a new filter.
Start Page window provides some useful hints and links for first-time users in Get Started section.
News section shows the latest discussion threads from Expert Lotto discussion board. Click any thread title to open it in your web browser.
Note: Internet connection is required to see content in this section.
If you don't want to open Start Page on application startup untick the option at the bottom of this window. To open Start Page again click menu Help - Start Page.
![]() You can adjust the Level count also conveniently using a spinner field in History toolbar.
You can adjust the Level count also conveniently using a spinner field in History toolbar.
These options apply to hints in My Estimates window.
Default ranges min and max define the default range of History differences. These values are used for example in In Range Differences and in Difference Ranges statistics.
Note: This options panel opens from menu Tools - Options - History.